The Apex signal is a potent triangle signal for technical analysis that was created to revolutionize how traders recognize when a trend is ending and lock in profits. It takes influence from the renowned trading strategies of prominent financial markets figure W.D. Gann.
Kirill Borovsky, a follower of Gann, has improved and expanded upon his techniques, which are renowned for their accuracy in forecasting market movements. As a result, according to Borovsky, the indicator has an incredibly high reliability rate of 80–90% in identifying possible trend finishes and the best times to take profits.
Key Features of Triangle Indicator
This triangle indicator considers both user experience and accuracy. These are its most notable attributes:
- Versatility in Design: An intuitive user interface allows users to plot an infinite number of triangles on their charts. These geometric shapes serve as useful analytical tools that enable traders to see possible moves in the market rather than just being ornaments.
- Consistency Across Timeframes: The Apex Indicator maintains its effectiveness whether you’re viewing an hourly chart or a monthly overview, so your analytical structures stay intact and functioning regardless of your preferred way of viewing the market.
- Time Precision: The indicator’s capacity to forecast the most likely intervals for achieving predetermined objectives is one of its distinctive selling characteristics. It gives traders a considerable advantage in terms of timing their trades for optimal efficacy, with an accuracy of 60–70%.
- Early Trade Entry Signals: Based on historical data as well as real-time data, the indicator offers extra early trade entry signals. These trustworthy signals provide traders with early warnings about possible changes in the market because they never repaint.
- Complete Notifications: Traders are notified when they reach first and second zones, as well as the preliminary target. To guarantee that traders never miss a crucial market move, these alerts are sent via email, push notifications to mobile devices, and text and audible alerts.
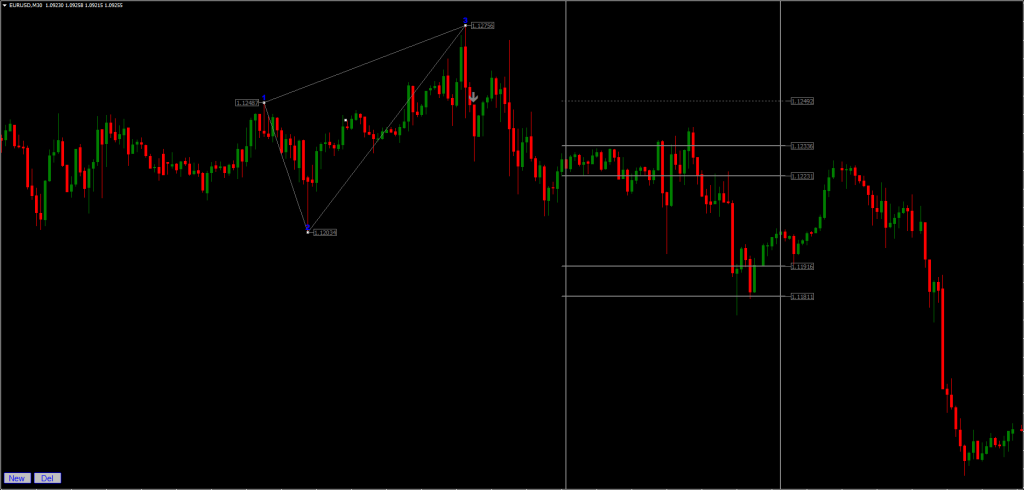
There is more to this triangle indicator than just a trading indicator system. Nonetheless, it can be a great asset to your trading as a tool for further chart research, determining the trade exit position (TP/SL), and more. Although this technique is accessible to traders of all skill levels, it can be helpful to practice on an MT4 demo account until you have the consistency and self-assurance necessary to move on to actual trading. With most Forex firms, you can open a genuine or demo trading account.
Any Forex currency pair as well as other assets including commodities, cryptocurrencies, binary options, stock markets, indices, etc., can be used with this Apex Indicator. Additionally, you may use it on any time period—from the one-minute charts to the monthly ones—that works best for you.
How to Use the Apex Indicator to Construct Triangles
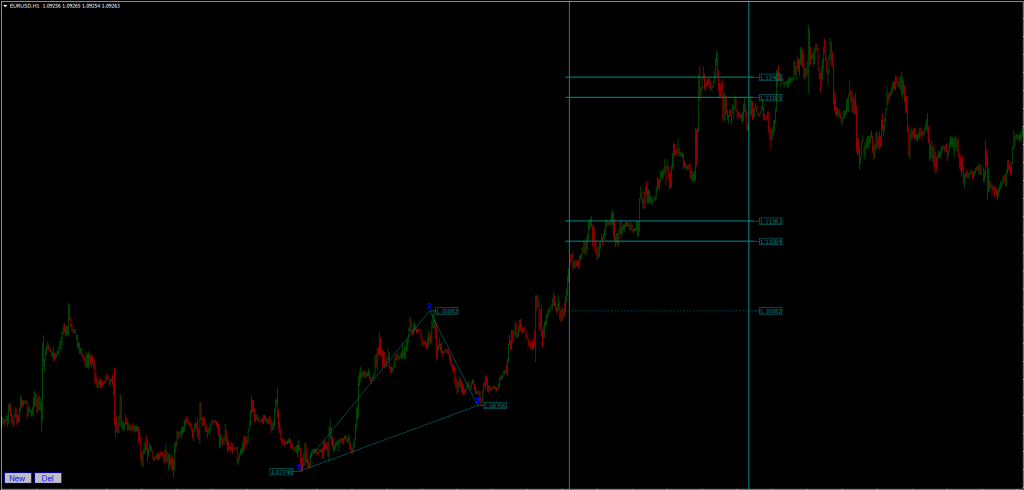
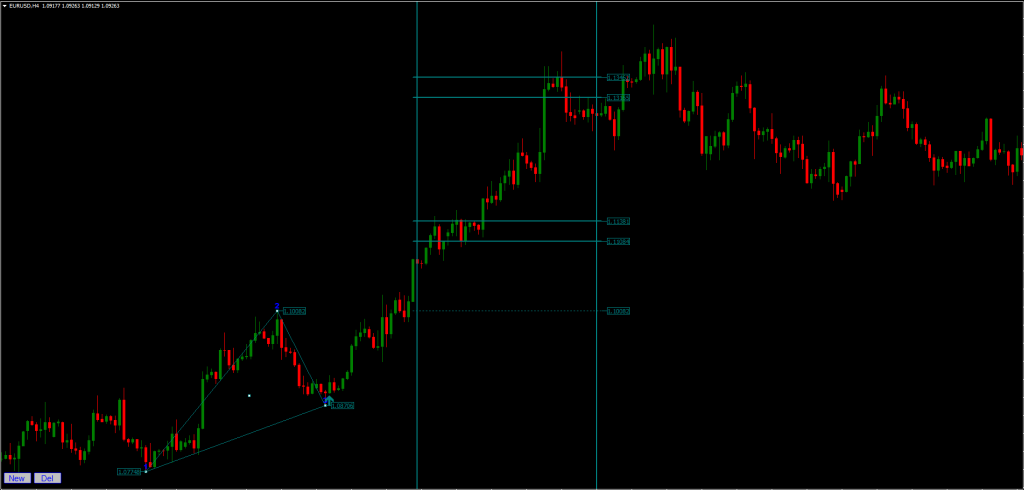
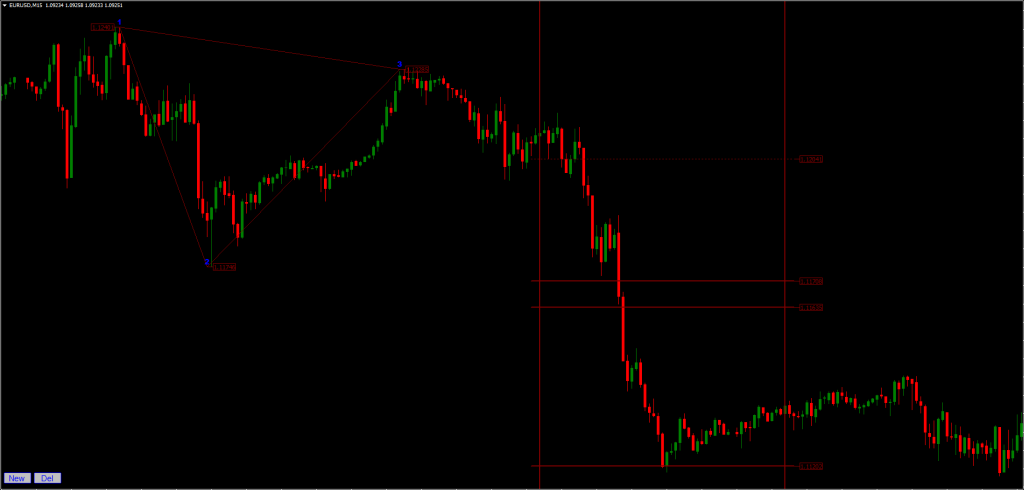
One of the most important skills for optimizing the Apex Indicator’s performance is building triangles. These geometric patterns serve as more than just markers; they are also effective tools that help traders spot possible market changes and the best times to enter or exit the market. Here’s a little tutorial on creating these perceptive triangles:
Starting with ZigZag
For individuals who may encounter difficulties throughout the construction process, the ZigZag indicator might serve as a useful gateway. Even a simple ZigZag might be useful in pinpointing the crucial locations for triangle building, giving precise goals to meet within the allotted time. With enough experience, traders will be able to recognize these crucial Pattern-123 points without the need for any further tools.
The Importance of Visible Vertices
Visibility is a basic requirement for placing the vertices of your triangles (Pattern-123 points). Even without a thorough examination, these points ought to be clear and obvious. Here’s how to recognize and use these ideas in various time periods:
- Lower Timeframe Targets: A triangle whose vertices are somewhat blurry might still be valid, but it represents the targets of a lower timeframe. In these cases, the ZigZag indicator might not clearly display the pattern, indicating the need for more granular analysis.
- Current Timeframe Targets: The optimal scenario for triangle construction is when the vertices align with the current timeframe’s targets, a condition often confirmed by the ZigZag indicator. The alignment of targets from multiple triangles at the same level significantly strengthens the potential of these levels.
- Higher Timeframe Targets: For broader market analysis, constructing triangles representing targets of a higher timeframe is more practical. Building and interpreting such triangles on these larger scales is often easier with the triangle indicator, offering insights into more significant market movements.

