The Double Top Bottom Patterns indicator for MT4 automatically scans the price charts to find the top trade opportunities for double top and double bottom patterns. Additionally, the indicator validates the price breakout after the pattern and offers buy and sell arrow trading recommendations. To trade the pattern rather than looking for one, forex traders might concentrate on doing so.
Both novice and experienced forex traders can benefit from the indicator. While experienced forex traders can combine support and resistance, channel breakouts, and trendlines for additional pattern confirmation, new traders will find it simple to identify the patterns. The pattern is effective on daily, weekly, and monthly charts as well as all intraday chart time frames, with higher time frame charts creating more important, tradeable patterns.
Double Top Bottom Patterns Indicator For MT4 Trading Signals
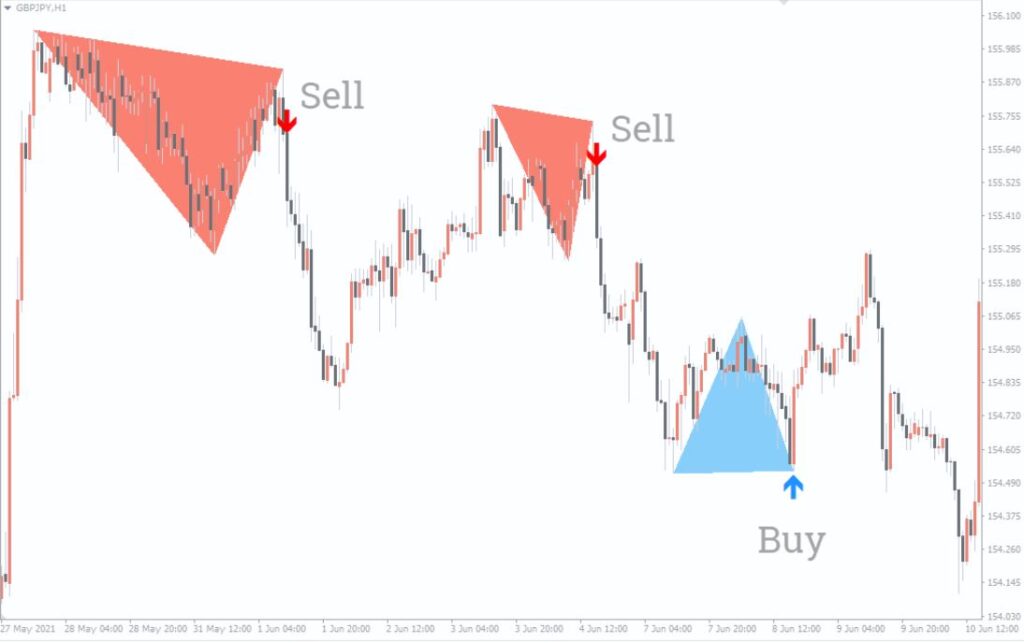
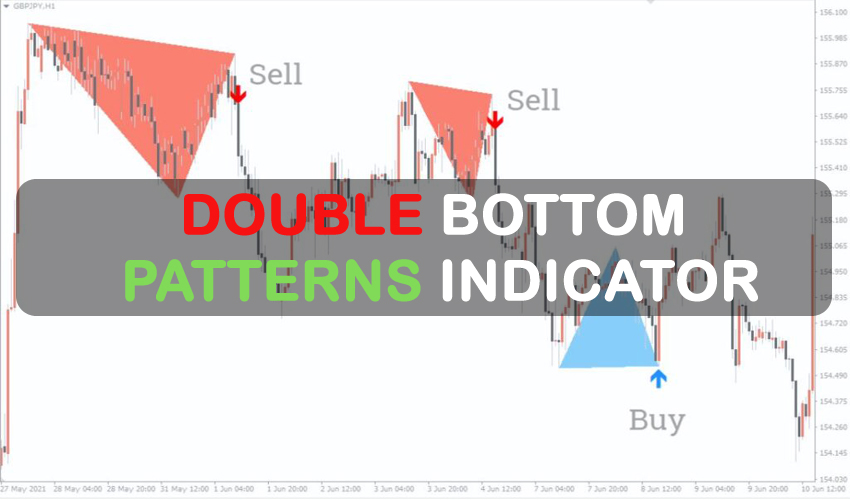
The Double Top-Bottom Patterns indicator for MT4 is displayed on the GBPJPY H1 chart above. Indicator displays bearish patterns in Salmon and bullish patterns in Sky Blue. Additionally, it displays the trading signals for buy and sell in RED and BLUE, respectively. If necessary, the indicator can recalculate and redo the patterns.
The indicator delivers BUY and SELL arrow trading signals when the pattern is finished and a breakout takes place. So that they can see the pattern, wait for a breakout, and enter the market, forex traders
A double top is a bearish reversal chart pattern in a similar manner. It indicates the start of a downtrend and the end of an upswing, allowing forex traders to enter the market and place a SELL transaction. Half of the pattern’s size is used for the stop loss, which is positioned above the entry point. The best take profit, however, can be attained by multiplying the pattern’s size by two.

