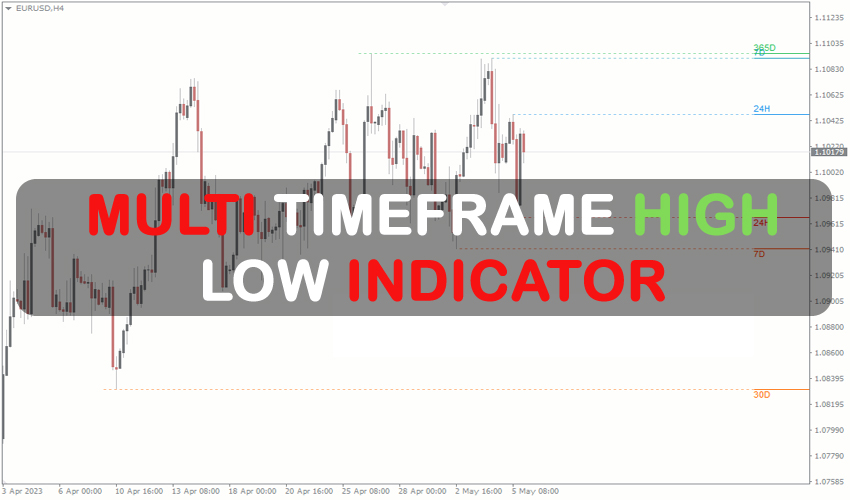
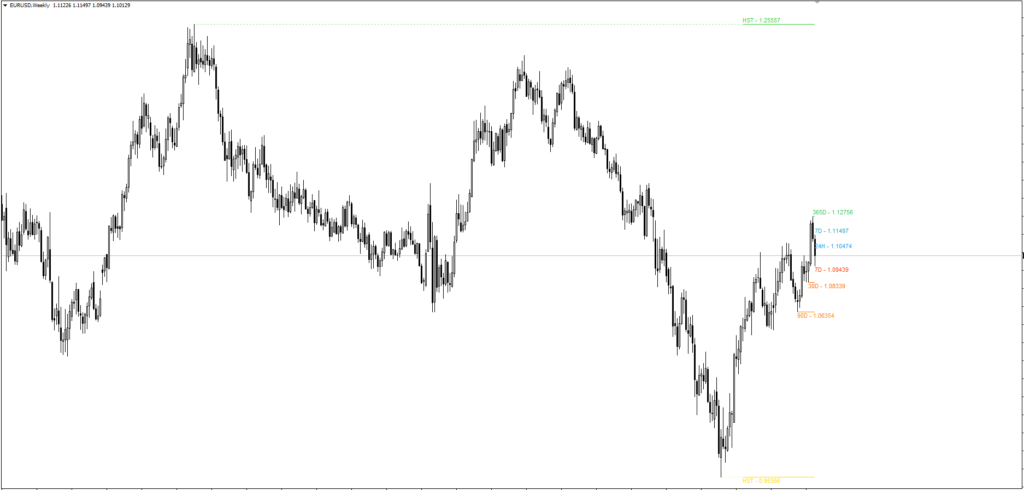
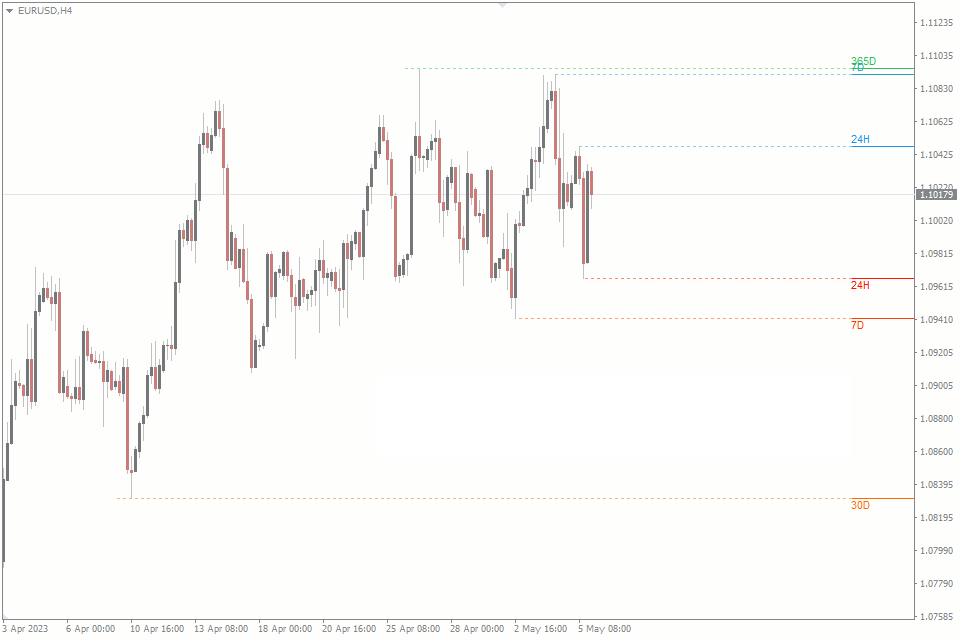
The Multi TimeFrame High Low levels in MT4 and MT5 terminals can be automatically drawn using this High Low Indicator, an MT4/MT5 indicator. The goal of the (Multitimeframe) MTF High Low forex indicator is to depict on the chart the prior high and low price points for TimeFrames. It is useful for historical, customary, and even modern times.
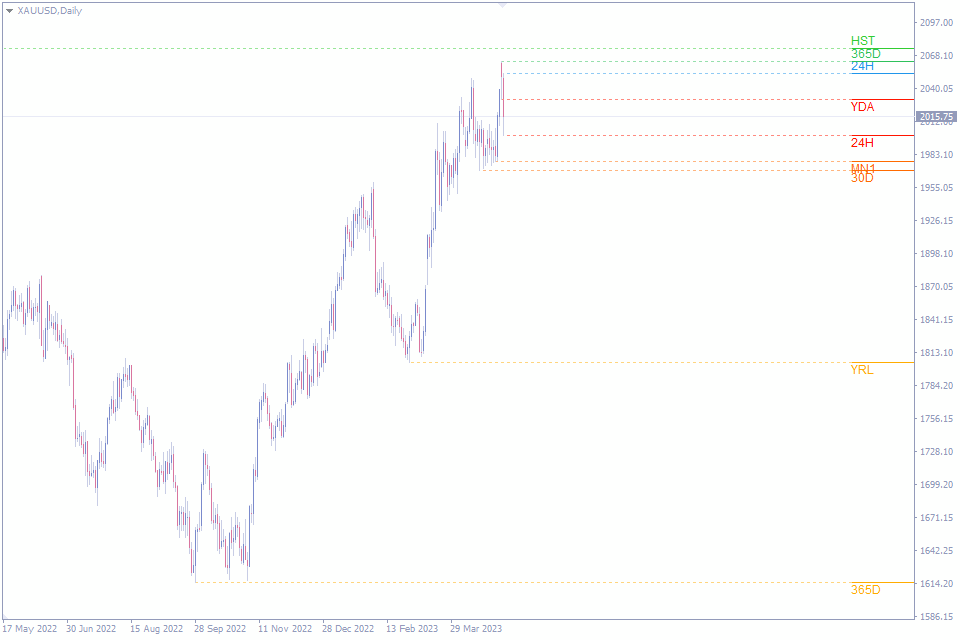
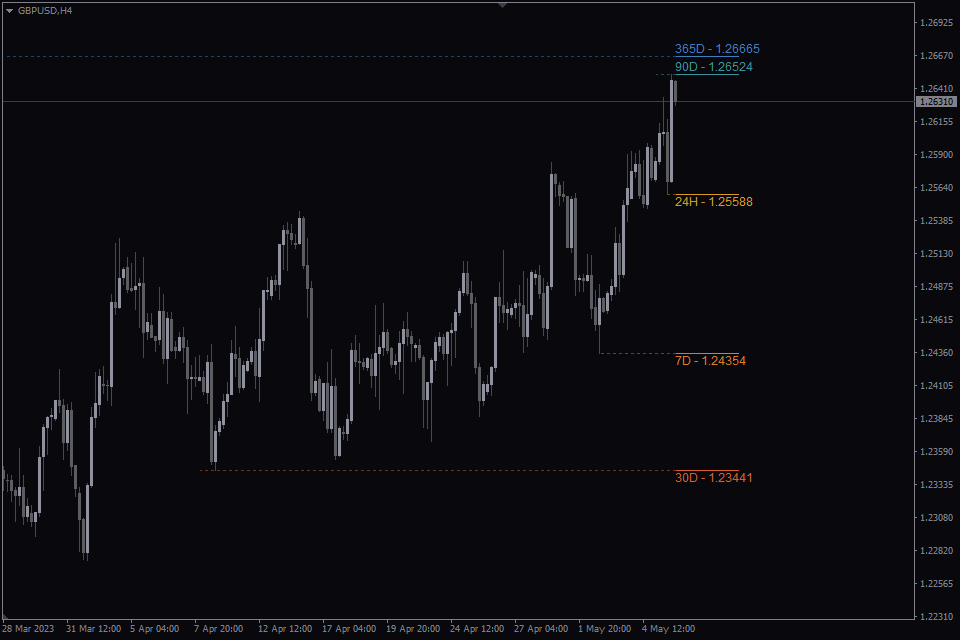
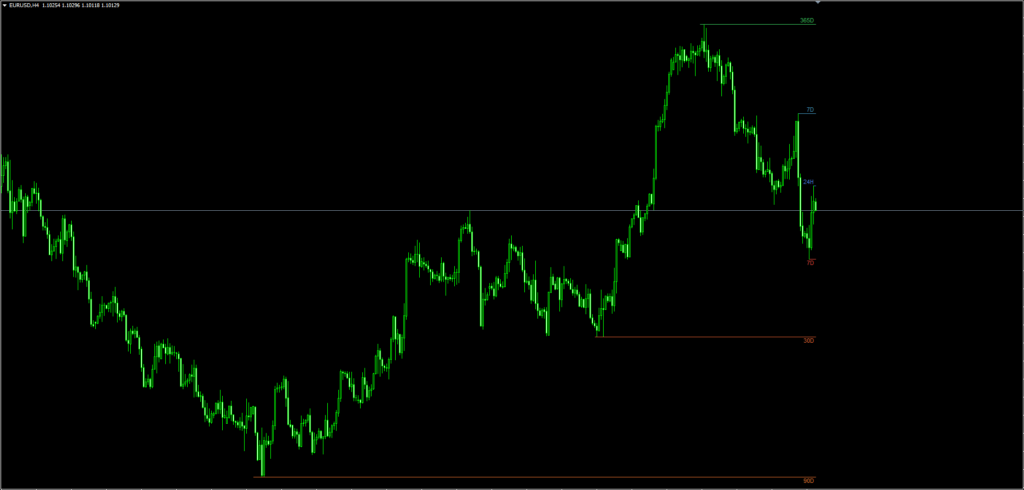
These levels are displayed as lines on the chart, each labeled with the period’s acronym, providing a clear picture of the price changes. Traders have the ability to choose from a variety of layout alternatives and enhance the visibility of these levels by adding price tags or dotted projections.
Any Forex currency pair as well as other assets including commodities, cryptocurrencies, binary options, stock markets, indices, etc., can be traded using this MTF High Low MT5. Additionally, you may use it on whatever time interval—from the 1-minute charts to the month charts—that works best for you.
There is more to this MTF High Low than just a trading indicator system. Even so, it might be useful for you in trading as extra chart analysis, for determining the trade exit position (TP/SL), and for other purposes. Although this technique is accessible to traders of all skill levels, it can be helpful to practice on an MT4 demo account until you have the consistency and self-assurance necessary to move on to actual trading. With most Forex firms, you can open a genuine or demo trading account.
This indicator is completely free and unrestricted by the fxssi.com website. This website has additional helpful paid and free indications. Thus, have a look at their other indicators and give the FXSSI Indicators some love.
How are High Low Levels used in Forex Trading
“High” and “low” in the context of forex trading denote the highest and lowest prices at which a currency pair was traded over a specific time frame. These could be daily, weekly, monthly, or annual, depending on the trader’s viewpoint and approach. Here’s a quick synopsis of each:
High: This is the maximum price that a specific currency pair can reach in a given time frame. It stands for the pinnacle of price movement.
Low: The lowest price that a currency pair can fall to in the same time frame. It denotes a low point in price movement.
One of the key data points utilized in price action charting for forex trading is the high and low. These price points can be used by traders to evaluate market volatility, create trading strategies, and identify possible resistance (high) and support (low) levels. Assuming that the trend would continue, a breakout strategy could, for instance, entail putting in a buy order if the price rises above the high or a sell order if it drops below the low.
Key Features of the Multi Timeframe High Low Indicator
The Multi Timeframe High Low Indicator distinguishes itself with its versatility and comprehensive range of functions and features:
1. Variety of Periods: The indicator draws high and low price levels to display periods such as today, yesterday, daily, weekly, monthly, yearly, and historical. Traders also can establish custom periods, tailoring their trading needs.
The acronyms for the periods are as follows:
- 24H: 24 hours
- 7D: 7 days
- 30D: 30 days
- 90D: 90 days
- 365D: 365 days
- TDY: Today
- YDA: Yesterday
- W1: This Week
- MN1: Month to date
- YRL: Year to date
- HST: Historical
- [n]H: Custom Hours
- [n]D: Custom Days
- Five Layouts: Traders have five layout options to select from: full width, current price (left), current price (right), high/low to the last candle, and the right side.
- Visual Customizations: Traders can add dotted projections to the high/low and price tags to show the level’s actual price in order to improve the levels’ visibility. Additionally, traders can adjust the text size to suit their needs. Additionally, MTF High Low MT5 has a custom preset option to adjust colors for each line in addition to two prebuilt color templates that accommodate light and dark backgrounds.
Utilizing the High Low Indicator to Spot Key Trading Levels
Traders can find important levels of support and resistance at various times with the help of the High Low Indicator. These levels are useful for identifying possible trade entry and exit positions, and they may also be used to create take-profit and stop-loss levels with good effect.
To start a long position, a trader might place a stop-loss at 1.1900 and a take-profit at 1.2000 if the indicator shows the daily high level at 1.2000 and the daily low level at 1.1900. Similar to this, these levels can be utilized to identify possible entry and exit positions for a swing trade if the weekly high level is at 1.2200 and the weekly low level is at 1.1900.
Particularly helpful in breakthrough trading tactics is the MTF High Low MT4. Important levels of support and resistance are seen by traders as indicators of a possible trend reversal or continuance when price movements break through them. If the indicator indicates that the current price is approaching a critical resistance level, traders may choose to take a long position in anticipation of a breakout. On the other hand, if the price approaches a crucial support level, traders could initiate a short position in anticipation of a breakdown.

