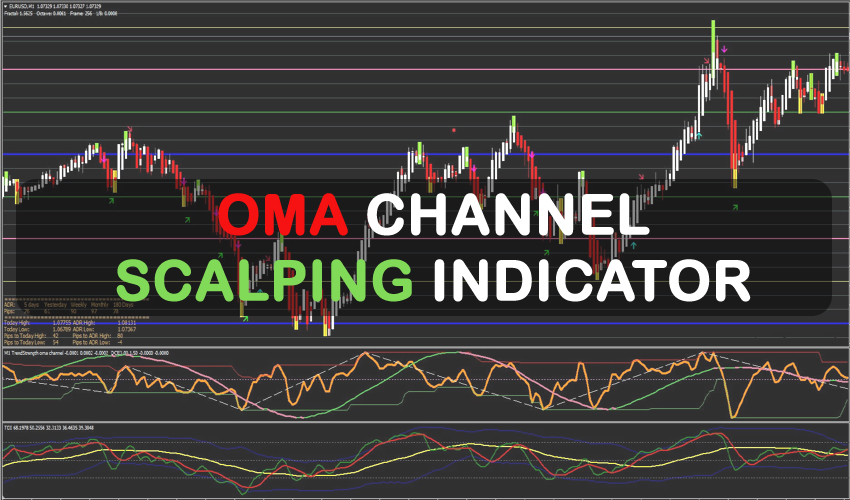
A NON-Repaint(Arrows) indicator method that provides simple buy/sell indications is the OMA Channel Scalping Strategy. Scalpers will benefit most from this setup. Based on price action and the OMA Channel, this trading strategy. This trading tactic uses high frequency.
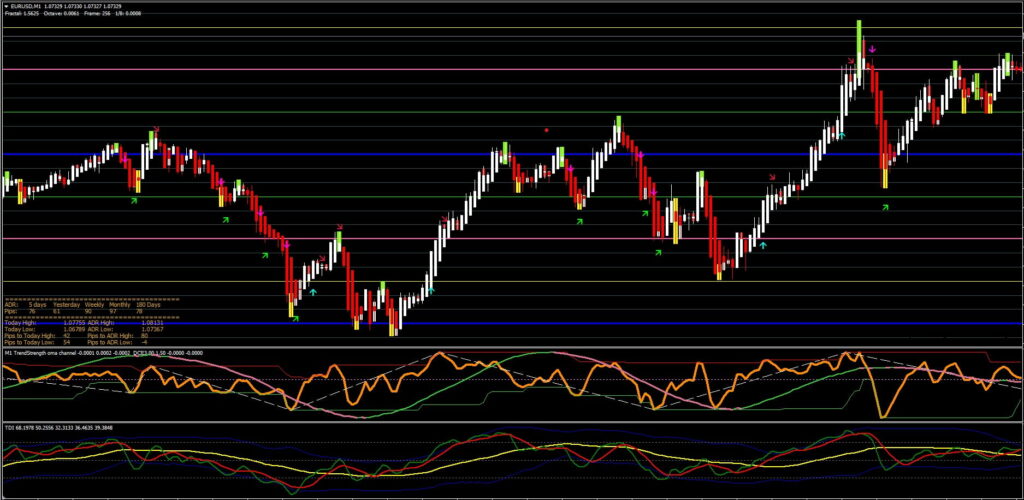
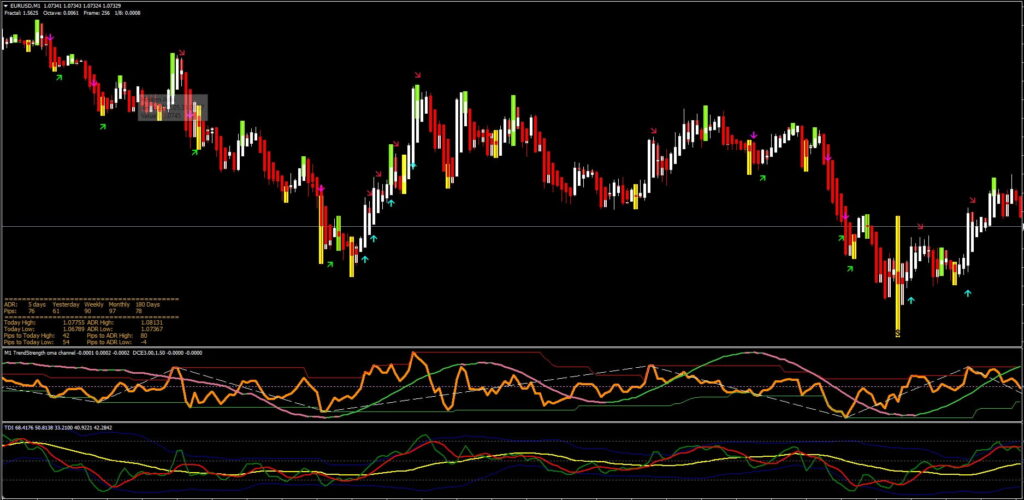
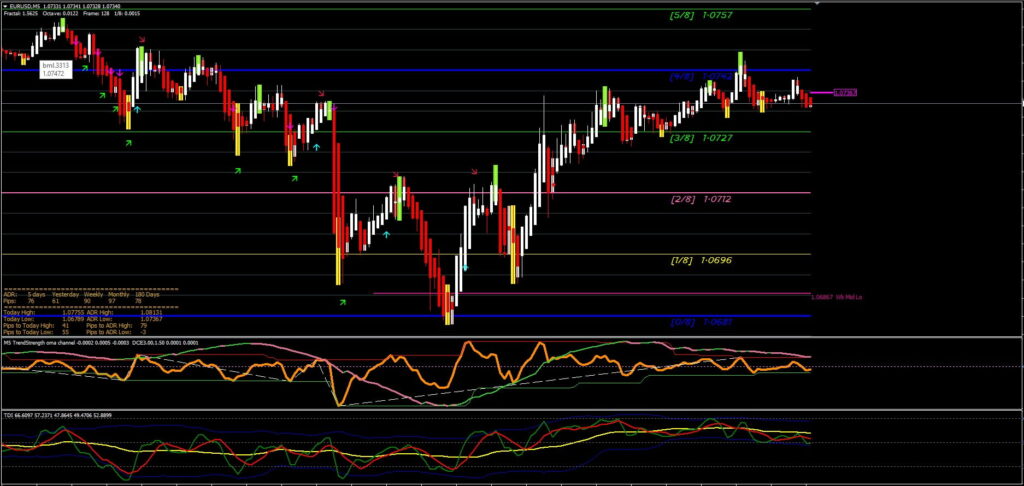
The two indicators in the sub-windows are what the OMA channel scalping indicator system is mostly based on. We have the trend strength channel indicator in the first sub-window. Here, there are essentially two lines that appear to move in a channel and are supposed to demonstrate how the market is changing. However, the choice of this indicator’s visual representation makes it extremely perplexing.
The TWS – TDI PRO indication can be found in the second sub-window. Here, we essentially have three lines that act as a moving average and can identify both an upward and downward market trend. This might be a difficult task or difficulty because trading decisions are only based on the indications in the two sub-windows.
The OMA Channel indicator system can provide trading indications that you can use as-is or further filter with further chart research, which is advised. Although this strategy can be used by traders of all experience levels, it may be helpful to practice trading on an MT4 demo account first until you are reliable and self-assured enough to trade in real time.
The OMA Channel Strategy can be configured to send you a signal notice via platform pop-ups or mobile notifications. This is advantageous since it allows you to monitor numerous charts at once and eliminates the need to spend the entire day staring at the charts in anticipation of signals.
Any Forex currency pair as well as other assets including equities, commodities, cryptocurrencies, precious metals, oil, gas, etc. can be traded using the OMA Channel Scalping Strategy. Additionally, you may use it on any time frame that works best for you, from 1-minute charts to 1-hour charts. On the M1 or M5 timescales, it performs best.
trading guidelines for OMA Channel Scalping Strategy
buy
- The price at Murray’s level or the ADR (bounced) indication level
- Oh, wait, it’s a yellow rectangle (TTM Scalper).
- indicator of trend strength OMA A green or blue arrow was painted on the channel.
- Heiken Ashi changed color.
- PA Dynamic changed to green.
- They are under the yellow (preferably close to the blue channel) and the green TDI line has crossed the red from the bottom up.
sell
- The price at Murray’s level or the ADR (bounced) indication level
- A green rectangle is what you should be looking for (TTM Scalper).
- indicator of trend strength OMA A red or purple arrow was channel painted.
- Heikeken ashi turned red.
- PA Dynamic went dark.
- They are above the yellow (preferably close to the blue channel) and the green TDI line crossed the red from top to bottom.
Stoploss and TakeProfit
- Goals are those with five or more points.
- Goals are those with five or more points.

