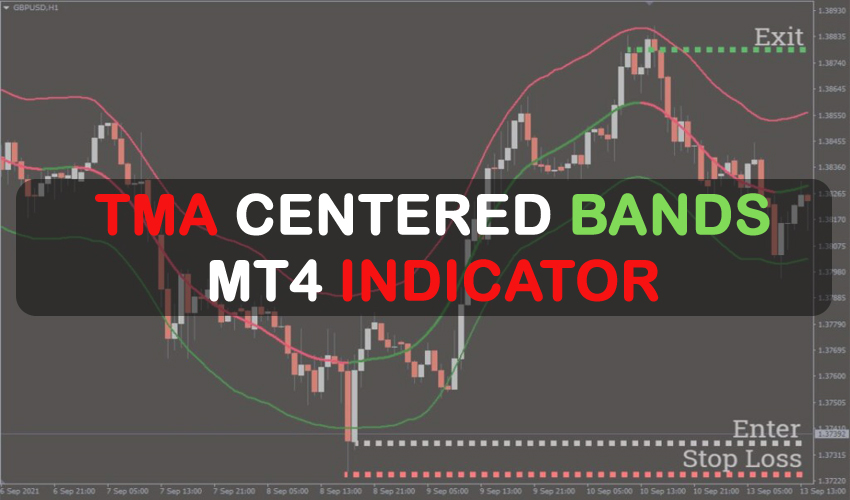
The TMA Centered Bands Indicator for MT4 displays bands on the chart and provides you with information about the general price trend. For instance, it displays three bands of the colors red, green, and red-green.
Red is present in the upper bands, red is present in the lower band, and red-green is present in the center band.
Moving averages make up the bands, and each one of them has an MA period. As the indicator creates triangle bands, TMA is an acronym for triangular moving averages.
Every time a trend shifts, the price will oscillate between these bands, creating entry and exit points.
How to trade the TMA Centered Bands Indicator?
Moving average power is used by the TMA Centered Bands Indicator to draw bands on the chart.
The functions of each band vary. For instance, there is a possibility that the price will revert when it crosses above the top band. Similar to this, a reversal could occur if the price drops below the lower band. The middle band measures the trend and changes color from green to red depending on which way the trend is moving.
When the price crosses the top band, you can open short positions. On the other hand, if the price drops below the lower band, you can enter a long position.
Between the top and lower bands, the middle band acts as a bridge. A trend becomes red or green whenever it alters its course. An upswing is indicated by green, whereas a decline is shown by red.
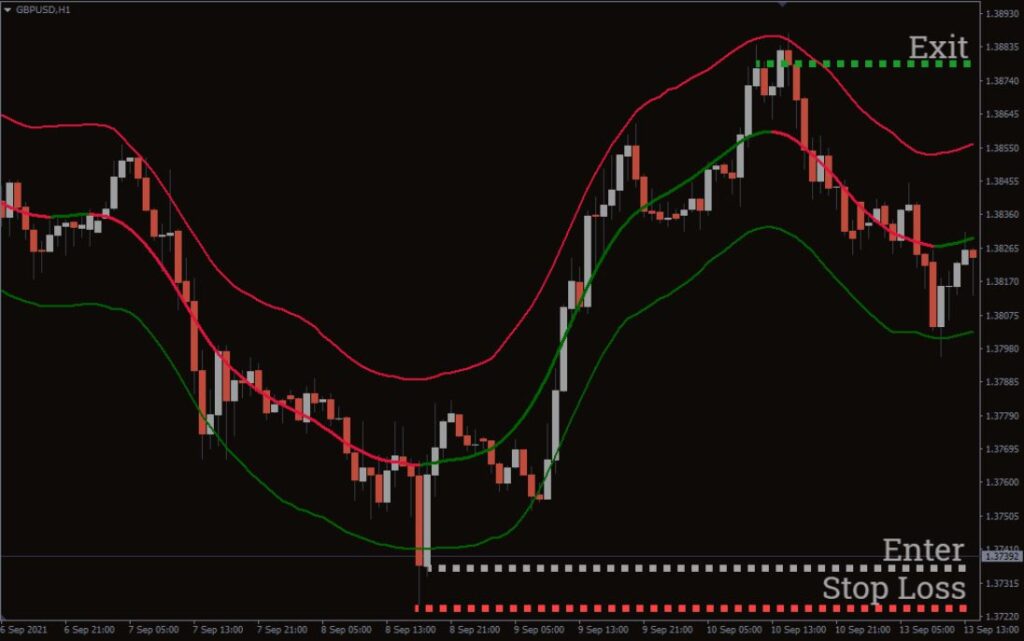
TMA-centered bands buy strategy
- The price should go below the lower band.
- Please wait for the price trend to continue its route.
- Enter the long trade at the lower band.
- Place a stop-loss near the low of an entry point.
- Exit the trade when the middle band turns red.
TMA centered bands sell strategy
- The price should go above the upper band.
- Please wait for the price trend to continue its route.
- Enter the short trade at the upper band.
- Place a stop-loss near the high of an entry point.
- Exit the trade when the middle band turns green.
Conclusion
You may use the TMA Centered Bands Indicator with any trading strategy because it functions on all timeframes. Additionally, the indicator gives you a broad overview of the trend’s direction.
There is a chance of losing money with the indication because there is no perfect system.
To strengthen the trend, you can also combine the TMA Centered Bands Indicator with other confirmation indicators like moving averages or the RSI.

