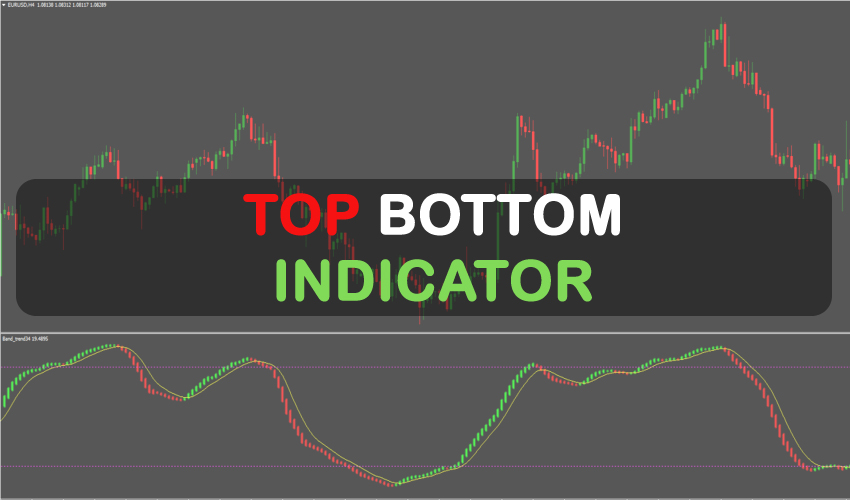
Top Bottom Indicators provide a major advancement in manual trading tactics by identifying the tops and bottoms of market patterns. This indicator is special since it guarantees that it won’t repaint or stray, providing traders with a trustworthy compass in the frequently choppy waters of the currency markets.
Understanding Top and Bottom in Forex
Understanding tops and bottoms in the forex market is essential before delving into the details of the Top and Bottom indicator. To put it simply, a “top” is the highest price level attained prior to a decrease, or the peak point in a price trend. On the other hand, a “bottom” is the lowest price point prior to an increase and represents a trough in the trend. For traders looking to buy low and sell high, identifying these points is essential, making the top and bottom indicators essential tools in their toolbox.
There is more to this Forex Top Bottom indication than just a trading indicator system. Nonetheless, it can be a great asset to your trading as a tool for further chart research, determining the trade exit position (TP/SL), and more. Although this technique is accessible to traders of all skill levels, it can be helpful to practice on an MT4 demo account until you have the consistency and self-assurance necessary to move on to actual trading. With most Forex firms, you can open a genuine or demo trading account.
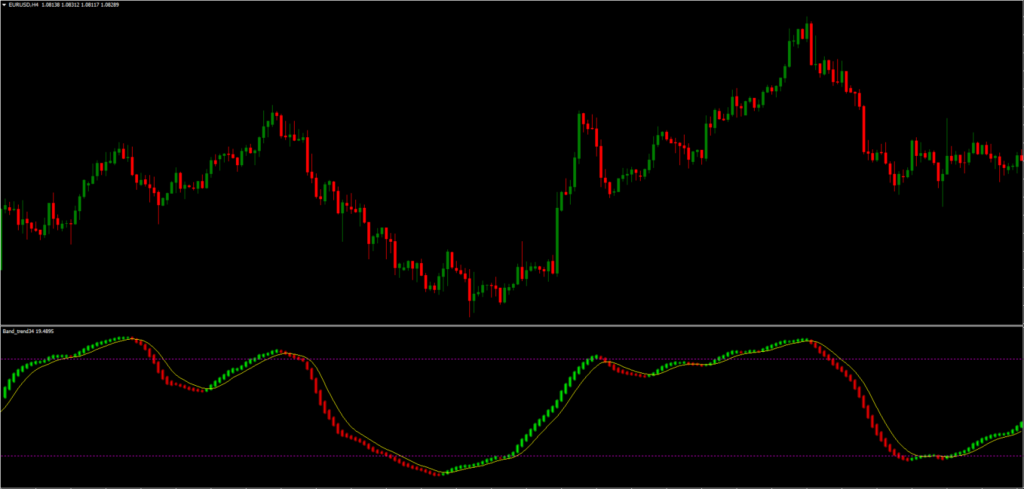
This indicator has the option to alert you with a signal. This is useful since it allows you to monitor numerous charts at once and eliminates the need for you to spend the entire day staring at the charts while you wait for signals to appear.
Any Forex currency pair as well as other assets like stocks, commodities, cryptocurrencies, precious metals, oil, gas, etc. can be used with this Top and Bottom indicator. Additionally, you may use it on whatever time frame—from the 1-minute charts to the 1-month charts—that works best for you.
Trading Rules of Top Bottom Indicator
- Buy Signal: The indicator triggers a buy signal when its color changes from red to green beneath the purple line. This transition signifies a potential upswing in the trend, marking an opportune moment for traders to consider opening a buy position.
- Sell Signal: Conversely, a sell signal is generated when the indicator’s color shifts from green to red above the purple line. This indicates a potential downtrend, suggesting that traders might want to consider closing their positions or opening a sell trade.
It’s important to note that the Top Bottom indicator is designed to be a supplementary tool rather than the sole basis for trading decisions. I personally advise against relying on it in isolation. Instead, I recommend integrating its signals into a broader trading strategy, using it to enhance analysis and decision-making processes.

