 |
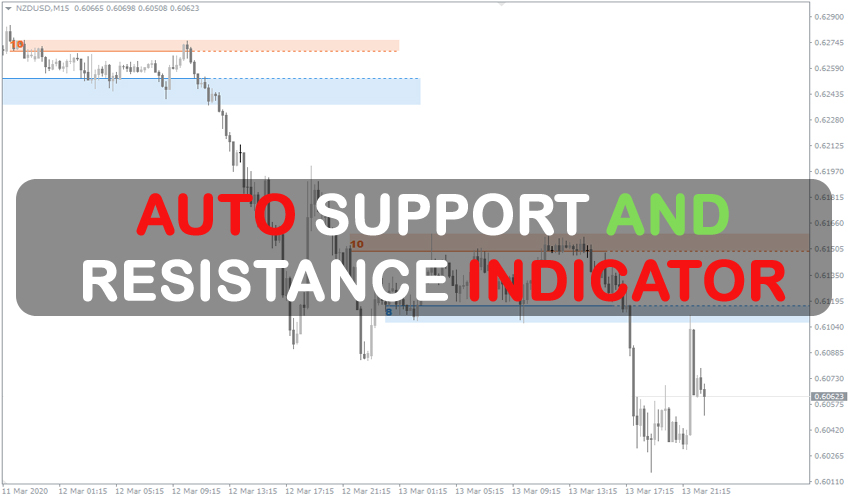
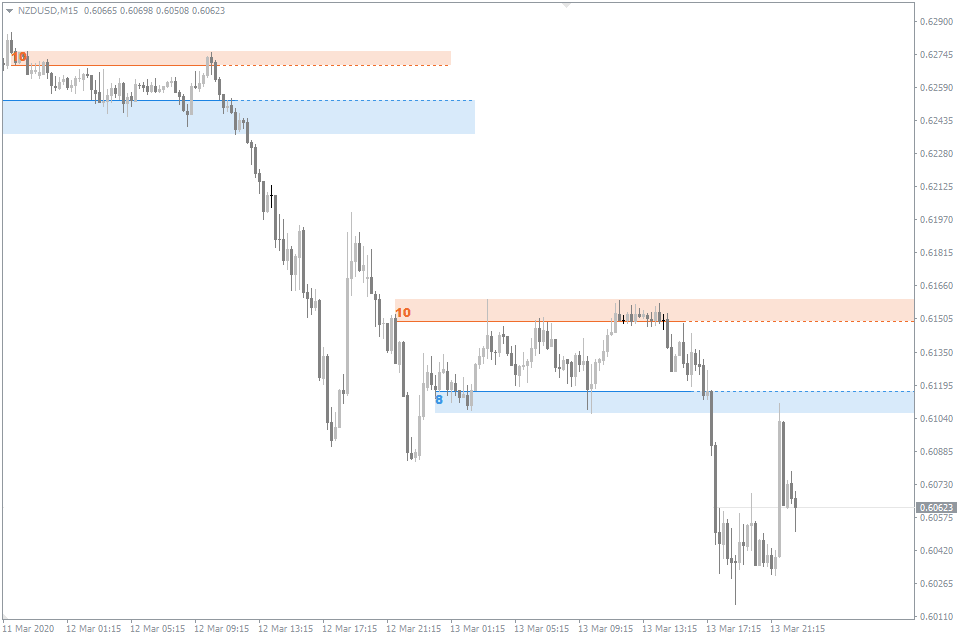
This automatic support and resistance indicator finds support and resistance levels and presents them on the chart for MT4 or MT5. The Support and Resistance Indicator identifies and automatically draws rectangular regions on the MT4 and MT5 charts where the price has previously interacted in order to assist traders in their everyday trading.
The distance between the price highs and lows that the level goes through determines the height of these support and resistance regions, which are represented by the colors orange for resistance and blue for support.
The Auto Support Resistance Indicator’s non-repainting is a noteworthy feature. The height of an existing support or resistance area, however, can enlarge in response to new price highs or lows that take place there.
Any Forex currency pair as well as other assets, including commodities, cryptocurrencies, binary options, stock markets, indices, etc., can be employed with this support and resistance MT4 indicator. Additionally, you may apply it to any time window that works best for you, from 1-minute charts to monthly charts. Working with timeframes between M15 and H1 is advised for best use.
There are no limitations placed on this indicator by the fxssi.com website. On this website, there are many beneficial free and paid indicators. So have a look at their other indicators and give the FXSSI Indicators some love.
Definitions of Support and Resistance
Technical analysis, a technique for assessing financial markets based on past price and volume data analysis, places a lot of emphasis on the ideas of support and resistance.
Support is a price level where there is sufficient purchasing interest to keep the price from falling any lower. In other words, support is a point at which the supply of an asset is greater than the demand for it, which causes a temporary pause or reversal of the downward trend.
In contrast, resistance is a price level where there is enough selling pressure to inhibit further price growth. When supply outpaces demand, resistance develops, temporarily halting or reversing the advance.
Support and resistance levels are frequently used by traders and analysts in technical analysis to pinpoint probable entry and exit points for trades. For instance, a trader might purchase an asset when it reaches a support level with the anticipation that demand at that point will drive the price higher. On the other hand, a trader can decide to sell an asset when it reaches a level of resistance because they believe the price will fall as a result of the selling pressure.
How it used in Forex Trading
To help them make trading decisions, forex traders frequently use support and resistance levels to pinpoint prospective price levels where buying or selling interest may be high.
Support and resistance levels in forex trading are often determined utilizing technical analysis tools like charts and indicators. To pinpoint important price levels, traders can use a variety of charts, including candlestick charts and line charts.
A support or resistance level can be used by traders to help them decide what to buy or sell. As an illustration, a trader might decide to buy a currency pair when it approaches a support level in the hope that the demand at that point will drive the price higher. As an alternative, a trader may decide to sell a currency pair when it reaches a resistance level, anticipating that the price will decline as a result of the selling pressure.
Support and resistance levels can also be used by traders to determine the stop-loss and take-profit levels for their transactions. For instance, if the price drops below a support level, a trader may set a stop-loss order right below it to automatically liquidate the position and limit losses. To lock in winnings, a trader may also place a take-profit order right below a resistance level. If the price hits that level, the deal will immediately be closed.
Overall, forex traders may discover prospective trading opportunities and manage risk by using support and resistance levels as helpful tools. Trading should always be done in conjunction with other strategies because these levels are not always precise and can be violated by unforeseen market developments.
| |
Who is Support and Resistance MT5 for?
Significant price reference points known as support and resistance levels help traders execute Forex deals. As a result, the Support and Resistance MT4 indicator works well with all other indicators and trading systems, which makes it a valuable tool in a trader’s toolbox.
It’s critical for beginning traders to learn how to independently draw support and resistance levels. For people without the necessary skills, the Support and Resistance MT5 indication can be helpful.
Since the indication saves time that would otherwise be spent sketching the levels, even seasoned traders can profit from it.
How the MT4 Spot Levels for Support and Resistance Work
The strategies traders employ to draw support and resistance levels are numerous. For instance, the Pivot Points indicator does this by using historical candlestick data. The Auto Support and Resistance Indicator, on the other hand, finds the levels with the most price hits.
To detect touches that reflect extreme price levels, the indicator uses a free Fractal indicator because touch is a subjective term and each person interprets it differently. The Auto Support Resistance indication can be used on any timeframe because the Fractal indicator’s formula is timeframe-independent.
The indicator algorithm finds the levels with the most price interactions and displays them on the chart after detecting and classifying touches.
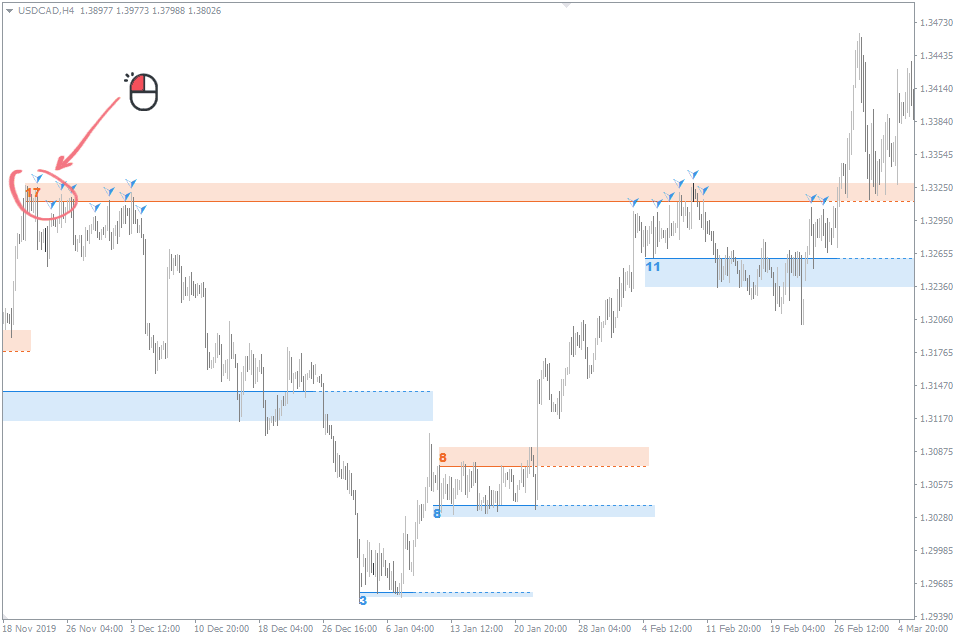
Click the weight number on the left side of the rectangle to view the price interactions with a certain level.
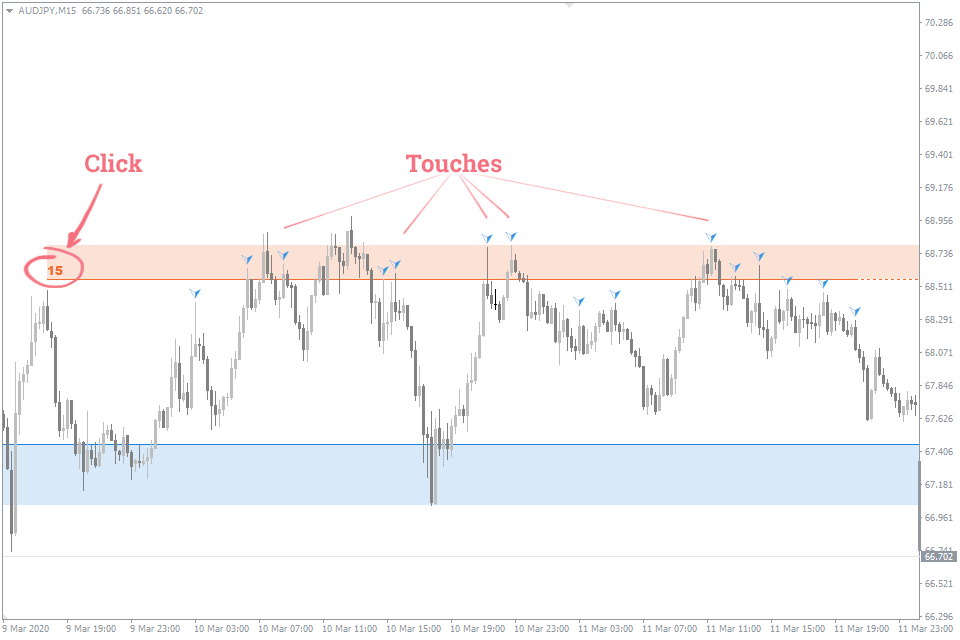
As you can see, certain interactions fall outside the boundaries of the full rectangle, but this is not a problem with the indication. To more precisely determine levels, these touches are used.
Just under 50% of the region examined by the algorithm is taken up by support and resistance levels.
| |
 | No Minimum Deposit ECN Acount No Commission | |
Min Deposit of 20$ |
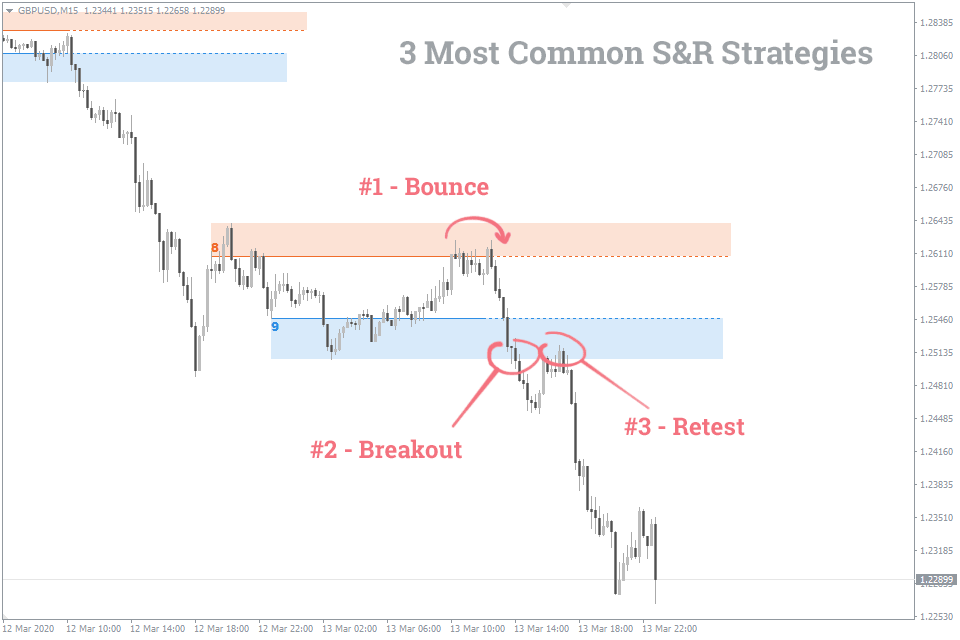
The Auto Support and Resistance Indicator: How to Trade?
There are three major techniques of trading with strong support and resistance levels:
- Rebound (Bounce) from a level,
- Level breakout,
- Retest of the broken level.
Below are three tactics that make use of support and resistance:
Support and Resistance Trading Strategy for the Forex
Support morphed into opposition Forex Trading Technique
A Step-by-Step Guide for Trading Forex Using Support and Resistance Levels
Auto Trend Channels Indicator can be another area of interest for you. It simplifies one of a trader’s most difficult tasks: determining the main trend. The indicator detects the exact trend lines and displays them on the chart automatically.
| |

| |