 |
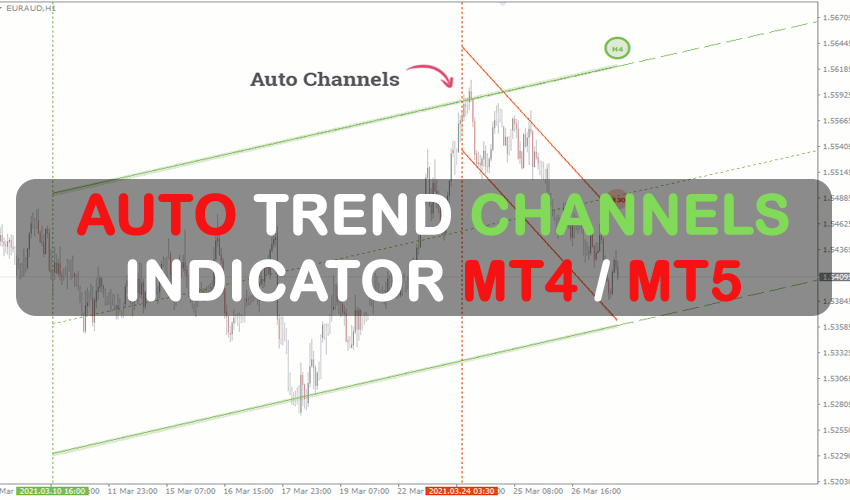
This Auto Trend Channels Forex Indicator finds the Trend Channels and automatically plots them on the chart for MT4 or MT5. One of the most common forex market analyses utilized by hundreds of traders worldwide is rend channels. I wanted to share this with other traders because I use it in my trading.
If you frequently use trend lines in your day-to-day trading, the provided indicator will make working with them much simpler and eliminate the need for you to manually locate and create the lines each time.
For the MT4 and MT5 platforms, the trend channel tool is the AutoChannels indicator. Based on the current price movement, it detects and shows price channels automatically on the chart.
Two parallel lines that make up the channel act as the price’s levels of support and resistance. The Trend Channels MT4 display channels for both short- and long-term timeframes (M1-M30 and H1-MN, respectively).
If new highs or lows are hit, the Trend Channels Indicator can change the angle of the channel to accurately reflect price movement.
Any Forex currency pair as well as other assets including commodities, cryptocurrencies, binary options, stock markets, indices, etc. can be traded with this AutoTrendChannels indicator. Additionally, you may apply it to any time window that works best for you, from 1-minute charts to monthly charts. M15-H1 are the best times to work with.
There are no limitations placed on this indicator by the fxssi.com website. On this website, there are many beneficial free and paid indicators. So have a look at their other indicators and give the FXSSI Indicators some love.

What is Trend Channels
In order to recognize and follow price trends in the stock market and other financial market analyses, trend channels are a technical analysis tool. They can assist traders in determining if a market is going upwards or downwards and whether prices are likely to continue in that direction or not. They are used to calculate upper and lower boundaries for the price of an asset, commodity, or currency based on previous price movements.
In order to create trend channels, a sequence of highs or lows are connected by a straight line that is extended at a slope parallel to the original trend line. Traders can create a channel where price activity tends to stay by linking these lines and using it as a guide for
In order to validate market trends and make wise trading decisions, traders frequently utilize other technical indicators in addition to trend channels because trend channels are not perfect and prices can frequently break out of the channel.
How it used
Trend channels are used in forex trading to spot and follow price patterns in currency pairs. Trend channels are used by forex traders to help discover prospective trading opportunities and establish the trend’s direction.
Using trend channels in FX trading looks like this:
- Detecting trends: Traders can determine whether a currency pair is in an uptrend, downtrend, or range-bound market by plotting upper and lower boundaries for price movements.
- Forex traders can use trend channels to determine the entry and exit locations for their transactions. For instance, if a currency pair is trending upward, a trader may try to purchase around the lower and sell near the upper bounds of the trend channel.
- Managing risk: Forex traders can control their risk and reduce possible losses by using trend channels to define stop-loss levels. For instance, in a long trade, a trader would place a stop-loss immediately below the bottom bound of the trend channel.
- Trend channels can also be used to verify trade indications produced by other technical indicators. For instance, a forex trader may wait until the currency pair reaches the upper bound of a trend channel before placing a long trade based on a moving average crossover signal.
It’s critical to remember that auto trend channels are not a foolproof predictor and that price frequently breaks out of them. In order to confirm market trends and make wise trading decisions, forex traders frequently combine other technical indicators with trend channels.
| |
Auto TrendChannels indicator: Who is it for?
A fundamental tool for technical analysis, trend channels are simple to incorporate into any indication or trading strategy. Trend Channels MT4 can offer helpful insights into price movements, particularly in trending directions, for people who are new to trading. Additionally, it enables traders to trade in lower timeframes while closely monitoring trends in higher timeframes.
You can learn the skill of analyzing price fluctuations within the channel and put your knowledge into practice by adhering to the strategies described below.
Trend channels MT5 provide as a helpful reminder for seasoned traders, saving time that would otherwise be spent drawing local and worldwide channels. Additionally, using the Auto TrendChannels indicator can be quite advantageous for traders who apply wave principles to their research.
How does the AutoTrendChannels Indicator draw trend channels?
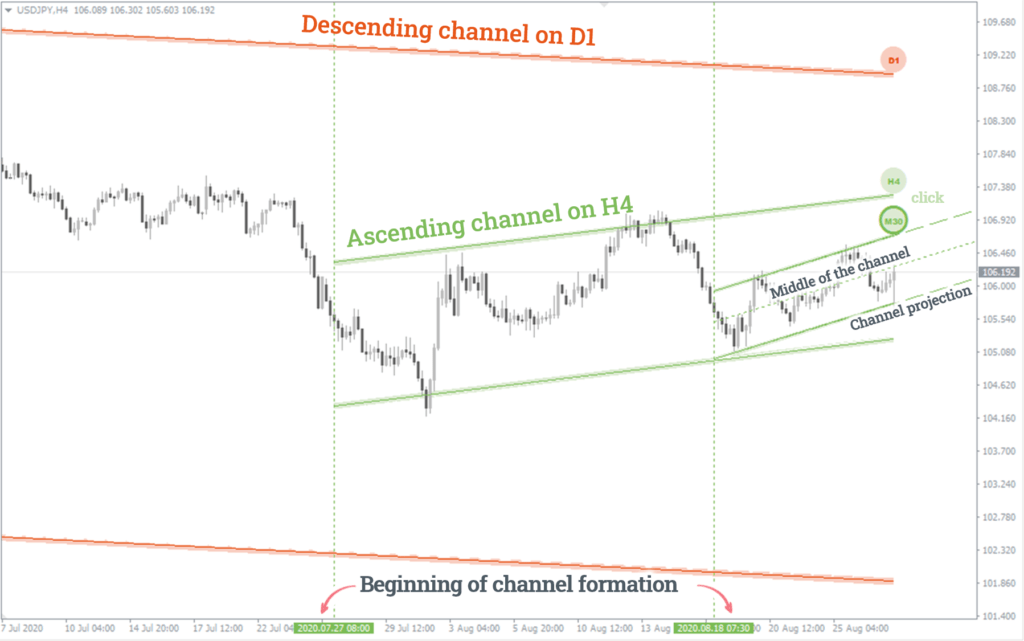
The Trend Channels Indicator examines the minimum number of price history bars (usually 200 bars) and detects significant highs and lows that constitute the first version of the channel in order to draw a price channel in each time frame. If the price crosses the channel’s upper and lower limits, the lines’ angle is changed such that it remains parallel to the prior trend.
If there isn’t a channel in any of the time frames, it may be because the bar history settings don’t allow for the creation of a channel with parallel lines. Additionally, if the price changes significantly over a period of time, producing inconsistent extreme points, there may be several price channels within the same time frame.
The channel will be shown as two parallel lines of the same color that extend from its starting point to the current price once the Auto Channels indicator has been implemented.
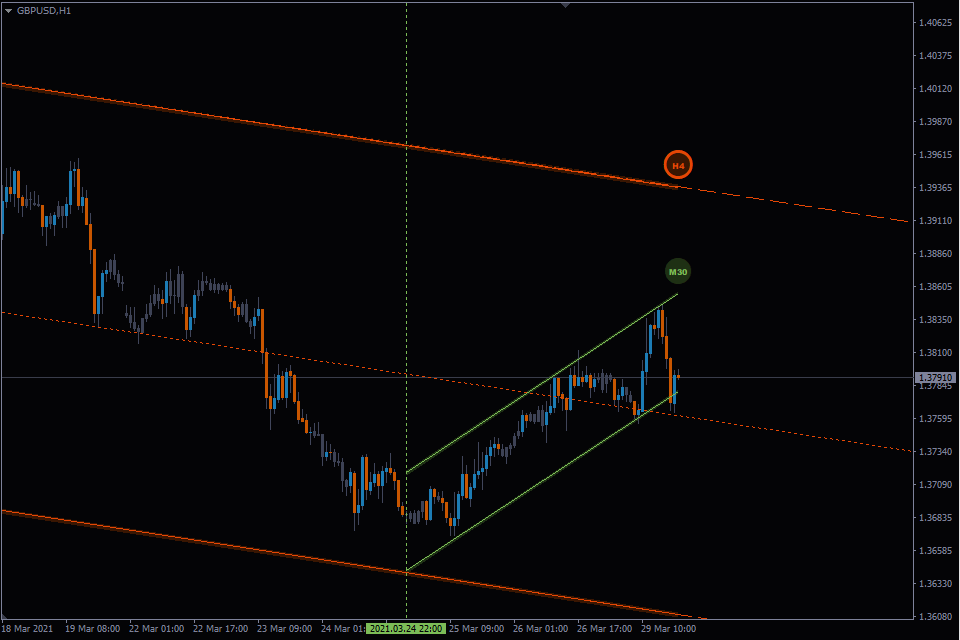
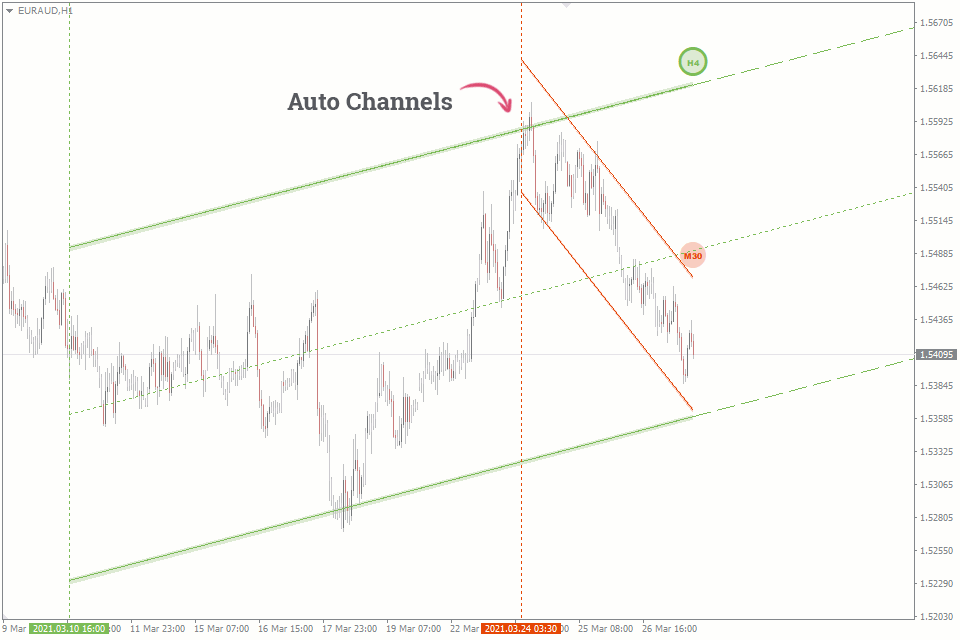
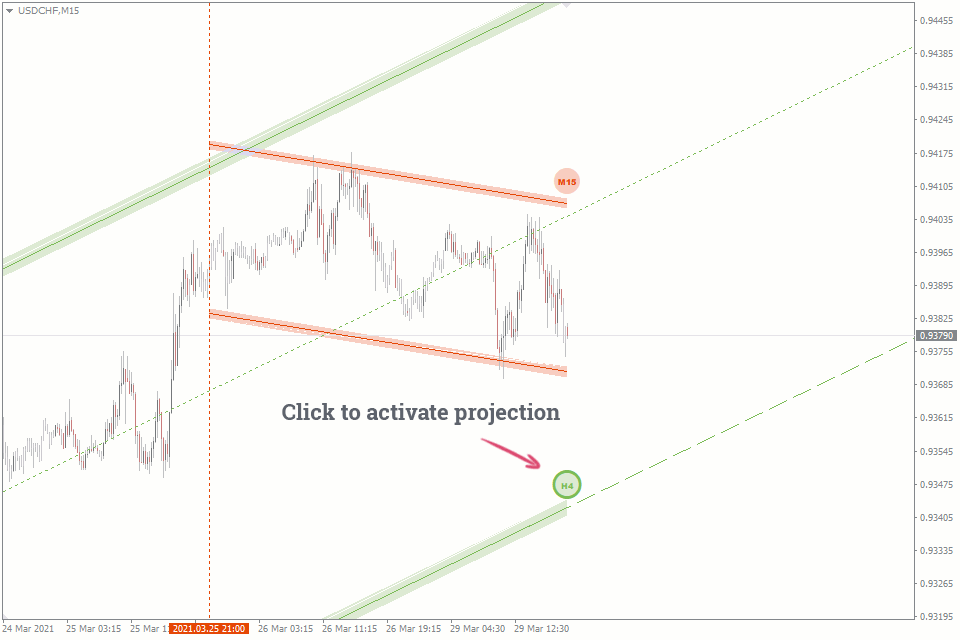
- Ascending channel (the green line).
- Descending channel (the red line).
A label that designates the time period to which each channel belongs is present alongside it. By clicking the marker, you can see the projections and midline for the channel. The midline might not always be in the middle since the algorithm might not choose High and Low prices that are equally spaced apart.
Depending on the time period in which they were drawn, the channel boundaries are depicted with varying thicknesses for better visual clarity. For instance, a channel’s border in the H1 time frame will be thicker than a channel’s barrier in the M15.
So, each channel on the chart consists of:
- Channel lines (solid with different thickness).
- Perspective projection lines (thick dashed line).
- Middle lines of the channel (thin dotted line).
| |
 | No Minimum Deposit ECN Acount No Commission | |
Min Deposit of 20$ |
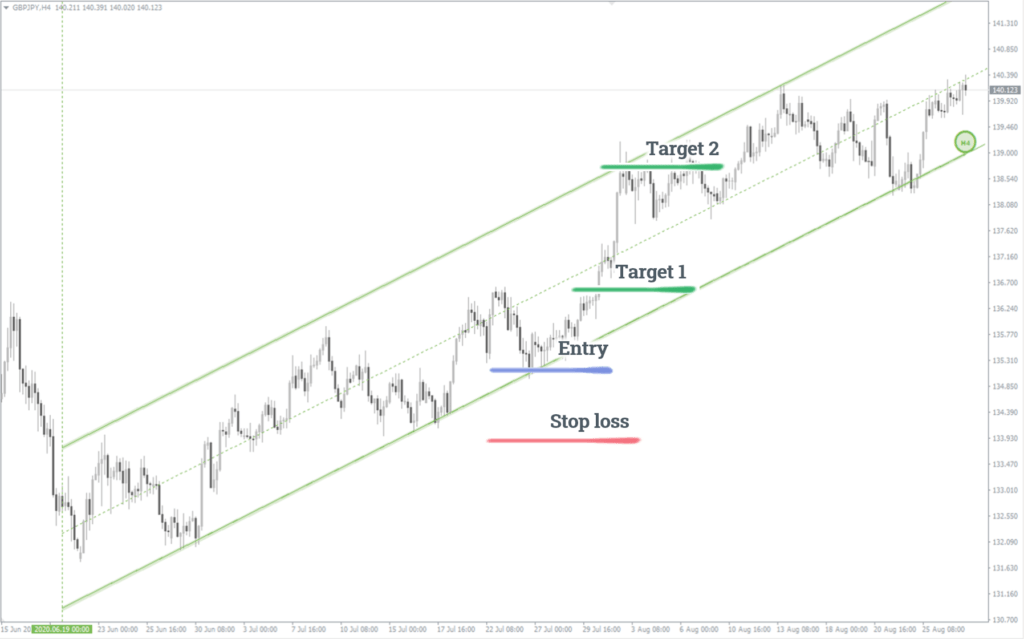
Bounce trading
In bounce trading, price changes inside the channel are anticipated. Traders buy when the price reaches the lower barrier, and sell when it reaches the upper boundary.
It is advised to set the Stop Loss behind the limits of the price action channel in order to manage risk. Depending on whether the channel is climbing or sinking, the Take Profit can be placed at the previous high or low or at the anticipated boundary on the opposing side. As an alternative, traders can follow the Stop Loss and Take Profit setting instructions provided in the technique book “Following the ‘Smart Money’.”
Retest trading
When the price crosses one of the channel boundaries and does not reenter it, this is referred to as retest trading. A breakout alters the “polarity” of the channel borders, which means that support levels become resistance levels in a breakout to the downside and resistance levels in an upward direction.
Usually, after a correction, the price will move toward the breakout boundary and then bounce off it, resulting in a retest. Whether the channel is ascending or dropping, now is the time to place a trade in the direction of the breakout.
- The channel boundary retest following its upward breakout is when a sell entry point is present.
- When the channel boundary is retesting following its downside breakout, this is the time to buy.
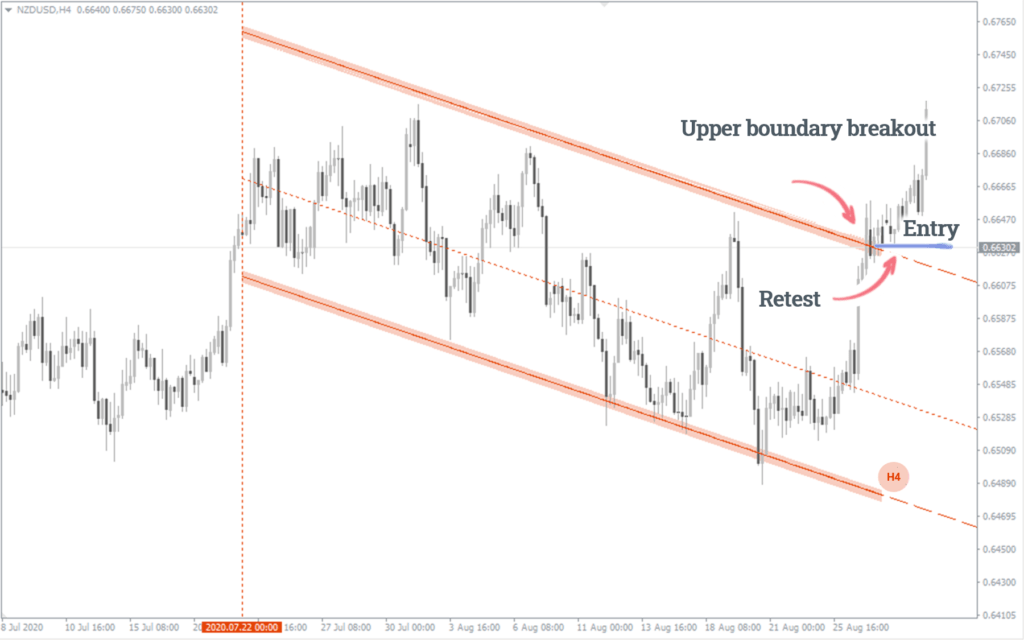
It’s critical to remember that price channels created in higher timeframes have more significance than those drawn in lower timeframes. Because of this, there is a greater chance that price will bounce back from the boundary in higher timeframes, both inward and outward (following a breakthrough).
| |

| |