 |
A complete trading tool for MT4 that provides NON-Repaint buy/sell signals is called the LUNA FX Indicator. Both novice and seasoned traders can utilize it to provide a simple trading platform. When trading in the forex market, this software is intended to assist users in making wise judgments. It has ON-SCREEN dashboards that display a variety of useful data.
The MT4 Trading Indicator combines cutting-edge technology with simplicity of use to create a potent tool. By offering precise research and reliable trading recommendations, this software is made to assist users in making knowledgeable judgments on the currency market. Users are able to open trades in sync with the major traders thanks to the sophisticated trend analysis calculation engine, which can identify trending markets. Furthermore, LUNA FX Software can alert users when it’s time to stop trading, enabling them to avoid flat markets and maintain an advantage.
It features four different templates that are tailored to specific trading approaches and market circumstances.
This MT4 trading indicator for forex is completely manual. The indicators generate the signals, but the trader ultimately decides whether to enter the market and whether to establish protection stops or profitable exit stops. As a result, the trader must be conversant with the concepts of risk and reward and set entries and exits using initial support and resistance levels.
You can add more chart analysis to the trade signals provided by MT4 LunaFX to further filter them, which is advised. Although this strategy can be used by traders of all experience levels, it may be helpful to practice trading on an MT4 demo account first until you are reliable and self-assured enough to trade in real time.
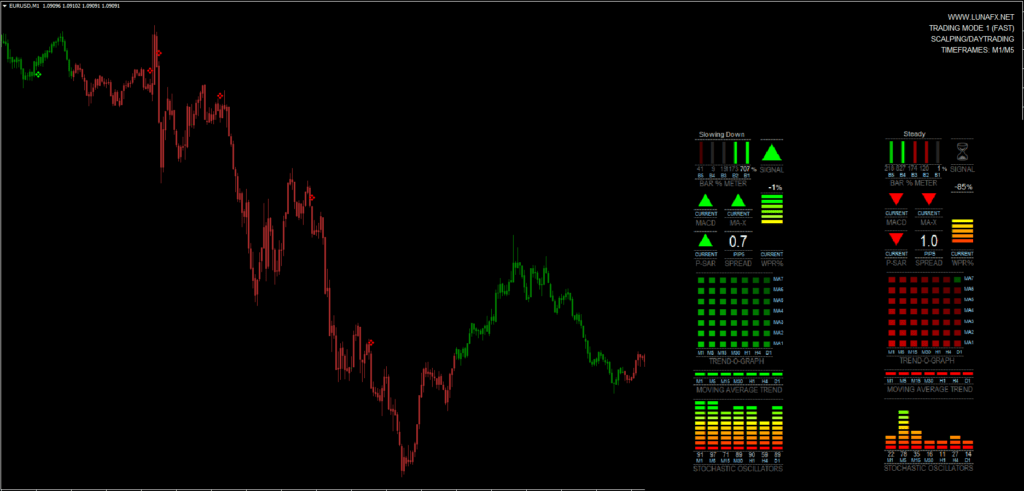
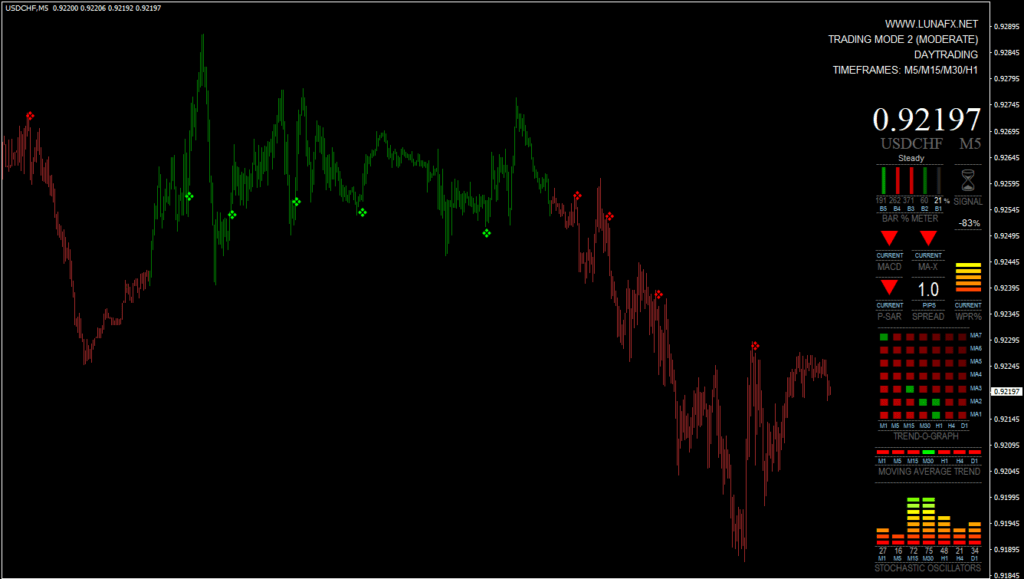
Features of the Luna FX Indicator Dashboard
a single sign that offers a wealth of information at a glance but which would typically require numerous charts, indicators, and a cluttered screen.
| |
- a chart showing stochastic oscillators over the timescales M1 to D1.
- employing moving averages on timeframes from M1 to D1, a trend in the market can be identified.
- the MACD’s movement on the current chart and the intersection of the zero and signal lines.
- the direction in which a quick 3-period LWMA crosses a 5-period SMA (customizable period).
- The Parabolic SAR’s direction on the current chart, which serves as both a confirmation for entrance and a signal for departure.
- An indicator for William’s% Range that oscillates. Due of its swift movement and distinct predicative nature, this was chosen. Additionally, it’s excellent at spotting Overbought/Oversold circumstances.
- To provide a clear visual depiction of the percentage increase or decrease in the current price relative to the previous four bars, a Bar% Increase/Decrease meter was created. It is easy to use but efficient. The basic idea is that since the close-to-close movements of the previous four bars are averaged and expressed as a percentage, the current bar is moving faster than the recent average if it gets above 100%. If it falls below 100%, on the other hand, it slows down and adopts a more constant motion. Bright red or green, with changing tints depending on how strong the movement is, is used to indicate strong price changes.
- The numerous indicator signals provide the basis for the overall signal that is advised for trading.
- Last but not least, the currency spread, displayed in large, visible numbers.
- a vertical line that serves as a history viewer and may be moved over earlier bars to display the past.
- A multi-timeframe trend graph displaying the seven moving averages on seven different timeframes and their direction.
- The Overbought or Oversold signals from seven separate oscillators or indicators on seven timeframes are displayed on an OB/OS Signal Map.
- Combining current and multi-timeframe indicator signals to create a customizable overall signal.
- Display of prices, charts, and currencies that can be turned on or off.
| |
 | No Minimum Deposit ECN Acount No Commission | |
Min Deposit of 20$ |
This Luna FX Indicator System is incredibly easy to use. With this strategy, even a total novice can begin trading and earning money. You can configure it to send you signal alerts via email, platform pop-ups, and mobile notifications. This is advantageous since it allows you to keep an eye on numerous charts at once rather than having to spend the entire day waiting for signals to come on the charts.
Any Forex currency pair as well as other assets including stocks, commodities, cryptocurrencies, precious metals, oil, gas, etc. can be traded using the MT4 Trading Indicator. Additionally, you may apply it to any time frame that works best for you, including charts for one minute to one month.
Even for complete newbies in forex, it is simple to use. It can be used by anyone; professionals are not required. Simply add one of the three available Templates to your chart.
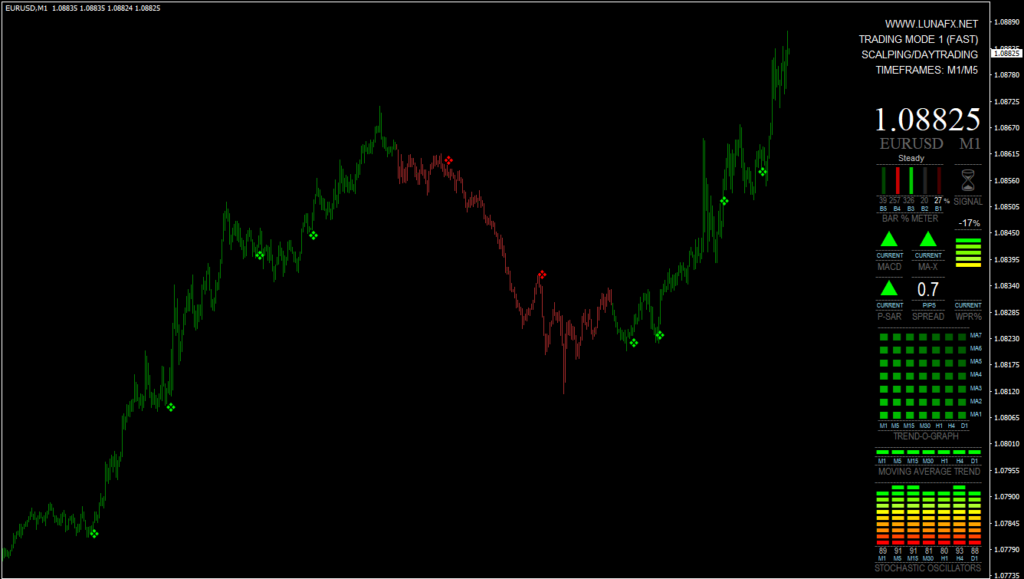
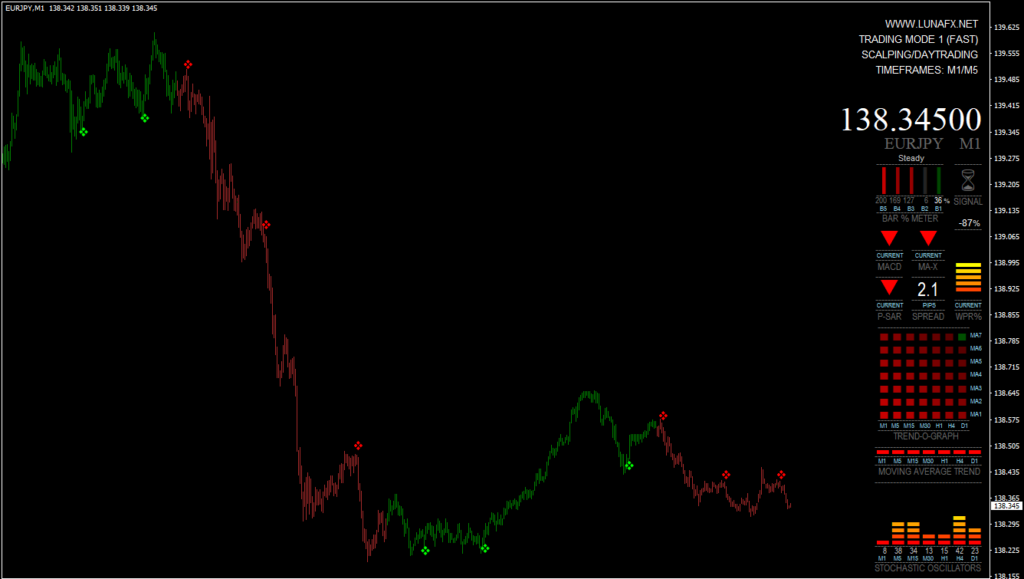
- LUNA-M1– is the fastest and most aggressive template. It provides faster signals with increased risk. This mode is ideal for fast day trading or scalping.
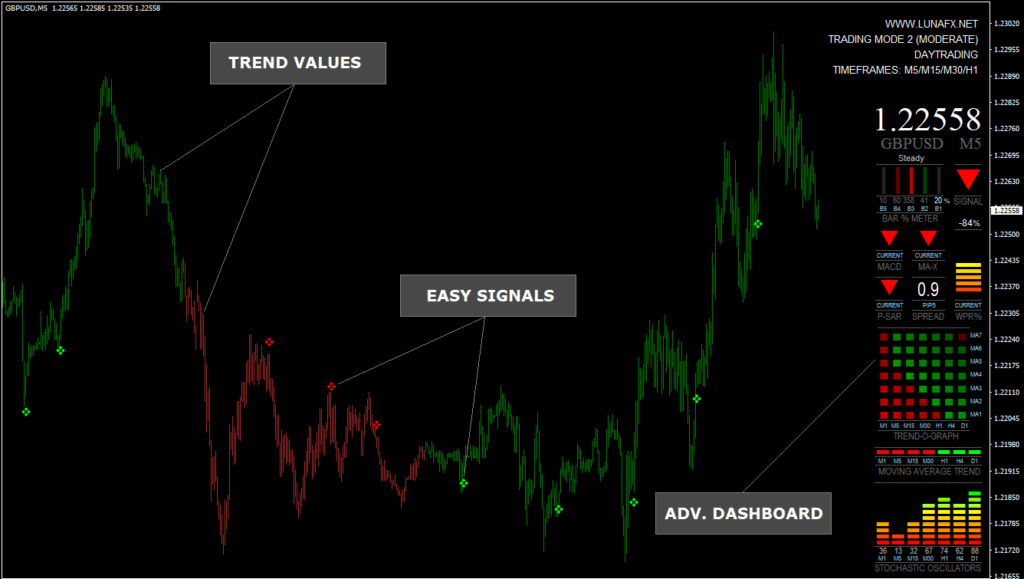
- LUNA-M2– is the standard, balanced template. Moderate risk and moderate signal speed. This mode is ideal for typical day trading/swing trading.
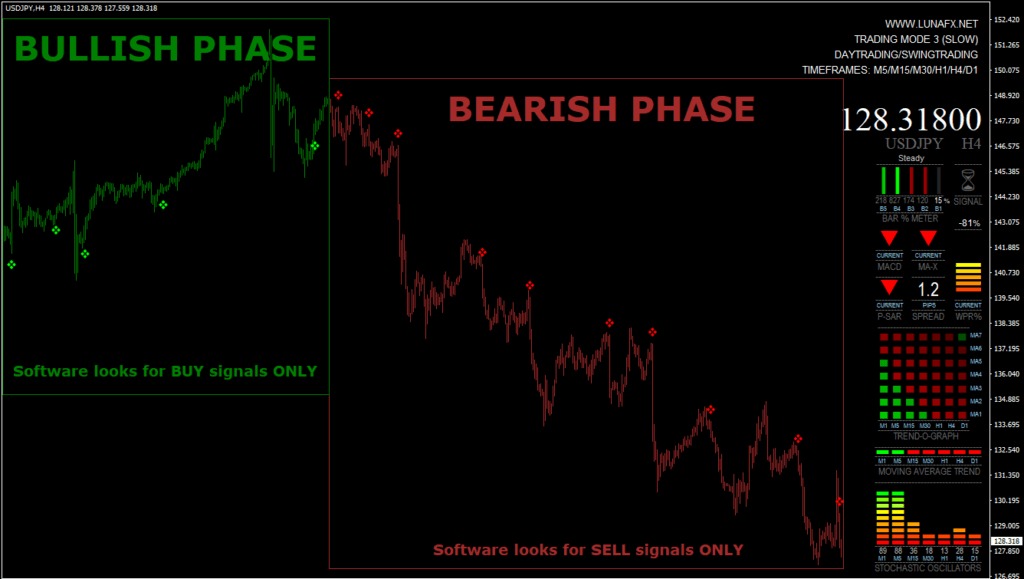
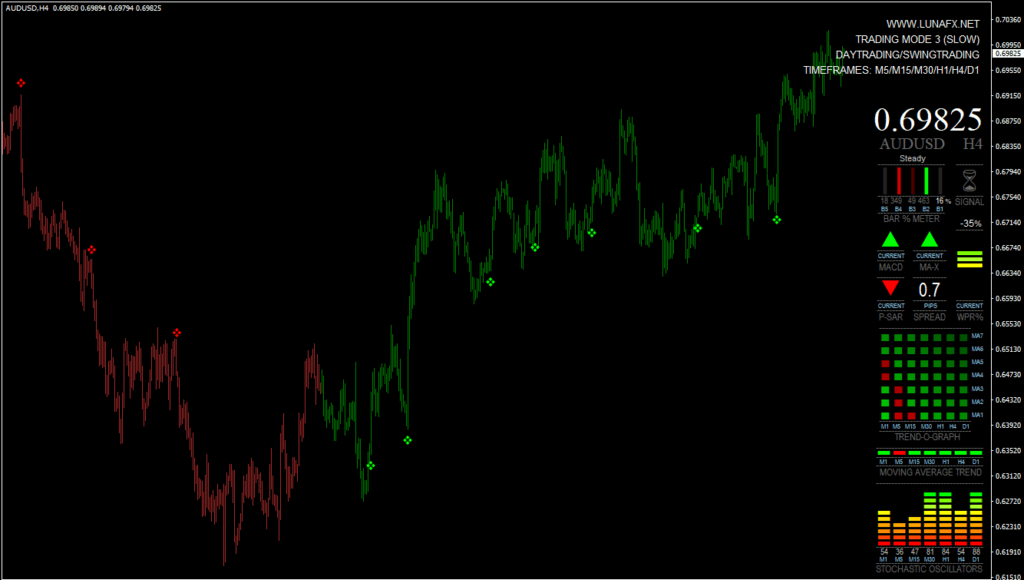
- LUNA-M3- provides the most conservative signals. The trend changes slowly and allows for catching the more significant moves on moderate / higher TFs.
Trading rules
Stick to your money management plan and avoid trading during a period of breaking news. Half an hour after the big currency news, stop your trades.
As usual, use wise money management to get the best outcomes. You need to master discipline, emotions, and psychology to be a successful trader. Knowing when to trade and when not to is essential. Avoid trading at times and under unfavorable market conditions, such as low volume or volatility, outside of the main sessions, with exotic currency pairs, wider spreads, etc.
Buy Entry
When you observe green candles on the chart, it indicates that the current market trend is bullish. These Green marks serve as buy signals and suggest that it would be beneficial to open a buy position.
Sell Entry
When you observe red candles on the chart, it indicates that the current market trend is bearish. These Red marks serve as sell signals and suggest that it would be beneficial to open a sell position.
Trade Exist
Any positions with this Forex Trading Indicator can be liquidated using a fixed profit target. Alternatively, the profit target should be set using previous support or resistance or high-low level as a reference point. You may also exit the trade manually if the conditions of the system reverse (the opposite signal appears).
| |

| |