 |
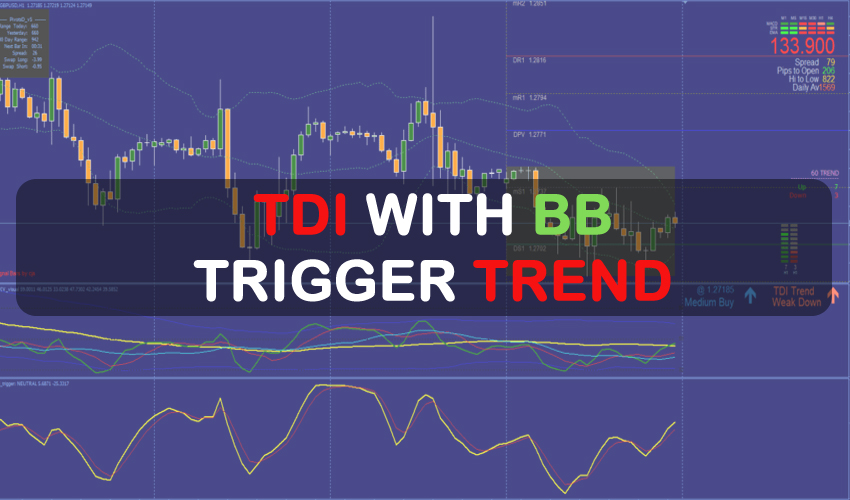
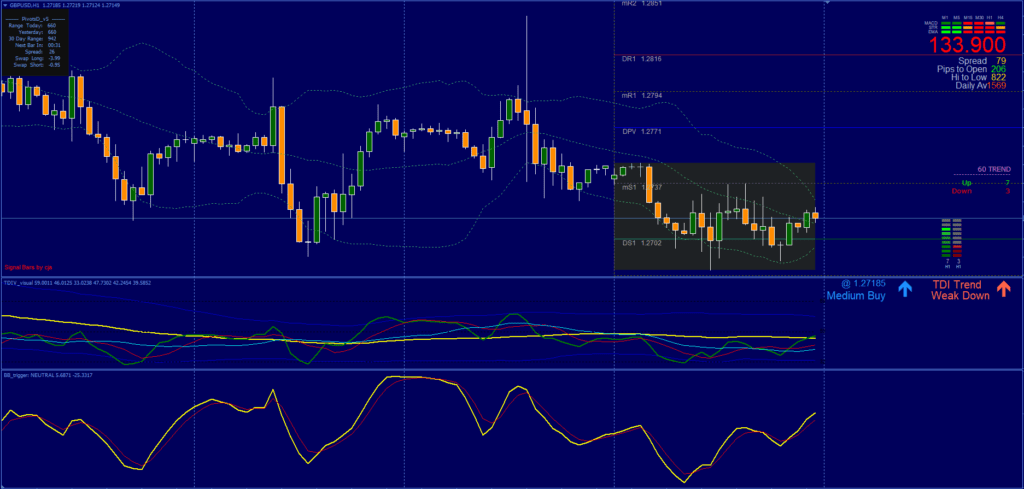
You can download the Trend Reversal Strategy TDI with BB Trigger for free. Bollinger Bands, Trader Dynamic Index (TDI), and BB Trigger are the three main indicators that form the foundation of the TDI with BB Trigger method, an advanced trading template. This method uses the overbought/oversold price position inside the Bollinger Bands to identify probable trend reversals. To ascertain the ideal moment for market entry, the BB Trigger and the TDI collaborate well.
This Trend Reversal Strategy’s Indicators
In order to fully understand this approach, let’s examine each element and signal in detail.
Bollinger Bands
A statistical graphic known as Bollinger Bands is used to describe the price and volatility of a financial instrument or commodity over time. They are made up of two standard deviation lines (upper and lower bands) and a simple moving average (middle band). The bands expand and diverge from the average when prices are extremely volatile, and they contract when prices are less volatile.
The way that the price interacts with the Bollinger Bands is crucial in this context of trend reversal strategy. According to the approach, traders should hold off on entering the market until the price breaks or bounces off the lower Bollinger Band.
Trader Dynamic Index (TDI)
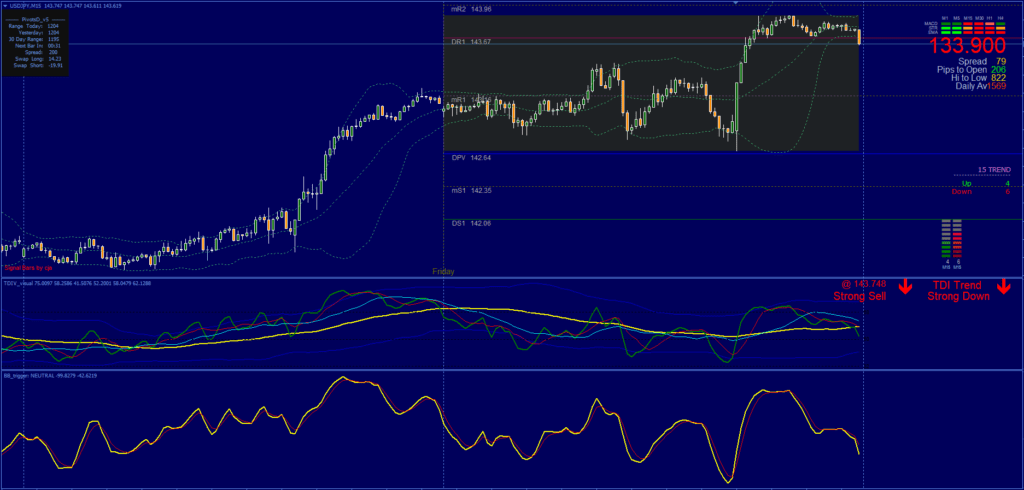
An indicator that collects data on market sentiment, volatility, and price direction is the TDI. A Green line denotes a fast-moving average, a Red line denotes a slow-moving average, and a Blue line represents the market baseline on the TDI. Possible reversals in the market can often be detected by the crossover of the green and blue lines.
When using this approach, traders should hold off until the TDI indicator’s green line passes over the blue line and points upward, suggesting that the price trend may be about to pick up.
BB Trigger
An additional important component of this Trend Reversal Strategy is the BB Trigger. When an asset is either overbought or oversold within the trader’s selected time range, this momentum indicator might indicate it. This in turn provides indicators of possible trend reversals.
An additional instrument for verifying trade signals is the BB Trigger. In essence, it is an oscillator that helps determine when the market is overbought or oversold, which helps determine the best times to enter and exit the market.
Pivot Points Levels
Technical analysis indicators known as pivot points offer a range of possible levels of support and resistance. They are typically determined using the closing prices, high, and low of the preceding trading session. Pivot point levels can be utilized as objectives to take profits in this technique.
| |
This TDI has a fully manual BB Trigger System. The trader will decide whether to enter the market, put protective stops, or take profitable profits when the indicators generate the signals. As a result, the trader needs to understand the concepts of risk and return and know when to enter and quit based on initial support and resistance zones.
This system can provide you with trade signals that you can use exactly as they are or, as is advised, refine the signals further by adding your own chart analysis. Although this technique is accessible to traders of all skill levels, it can be helpful to practice on an MT4 demo account until you have the consistency and self-assurance necessary to move on to actual trading.
Any Forex currency pair as well as other assets including equities, commodities, cryptocurrencies, precious metals, oil, gas, etc. can be traded using the trend reversal strategy. Additionally, you may use it on whatever time frame—from the 1-minute charts to the 1-month charts—that works best for you.
| |
 | No Minimum Deposit ECN Acount No Commission | |
Min Deposit of 20$ |
Trading rules
When utilizing this TDI with BB Trigger System, don’t forget to tighten your stop losses around High Impact News Releases or stay away from trading for at least 15 minutes prior to and following these events.
As usual, effective money management is essential to getting the best results. You need to understand psychology, emotions, and discipline in order to trade profitably. Understanding when to trade and when not to is essential. Steer clear of trading amid negative market conditions, such as low volume or volatility, after significant sessions, exotic currency pairs, wider spread, etc.
Buy Position: Hold off until the market rises or breaks through the lower Bollinger Band. Look at the TDI indicator after that. The goal is for the Blue line, which represents the market baseline, to pass over the Green line, which represents the current market price. The BB Trigger ought to signal a long position in the meantime. The green light to enter a buy position is given by this combination of circumstances.
Sell Position: Hold off until the market breaks or bounces off the higher Bollinger Band. Look at the TDI indicator after that. You would want the Green line, which represents the price on the market right now, to cross beneath the Blue line, which represents the market’s starting point. The BB Trigger ought to signal a short position in the meantime. This combination of circumstances gives the all-clear for
First Stop Loss: Risk management is crucial after taking a long position. Depending on your risk tolerance and the volatility of the market you’re trading, you should set your first stop loss at the previous low swing or 10 to 15 pip.
Options for Taking Profit: After the position is open, the following stage is to plan how to close it at a profit. For this, you have three choices:
- Middle Band: You can exit your position when the price reaches the middle Bollinger Band. This option is conservative, limiting potential losses and possibly limiting gains.
- Opposite Band: A more aggressive strategy would be to wait until the price reaches the upper Bollinger Band. This could maximize your profits, but it also carries the risk of the price reversing before it hits the upper band.
- Pivot Points Levels: A balanced approach could be to take profit at the pivot point levels, providing a good compromise between risk and reward.
| |

| |