 |
An MT4/MT5 indicator called the Trend Intensity Index Indicator is used to pinpoint the precise degrees of trend intensity. The Trend Intensity Index does more than merely indicate the direction of the trend. It is a comprehensive tool that gives traders information on the best times to enter the market, hold onto investments, and leave positions.
A technical analysis tool called the Trend Intensity Indicator is used to quantify how strong a trend is in a security’s price movement. The TII, created by M.H. Pee, is intended to help traders make better decisions regarding their trading strategy by indicating the start and finish of a trend.
Interpretation
- A trend is indicated by a positive TII value, with stronger uptrends being represented by bigger positive numbers.
- A downtrend is indicated by a negative value; bigger negative numbers indicate stronger downtrends.
- Values close to zero indicate that there is no clear trend or that the market is range-bound.
For optimal results, use the Trend Intensity Index in conjunction with other tools and methodologies, as with other technical indicators.
Trend Intensity Indicator Explained
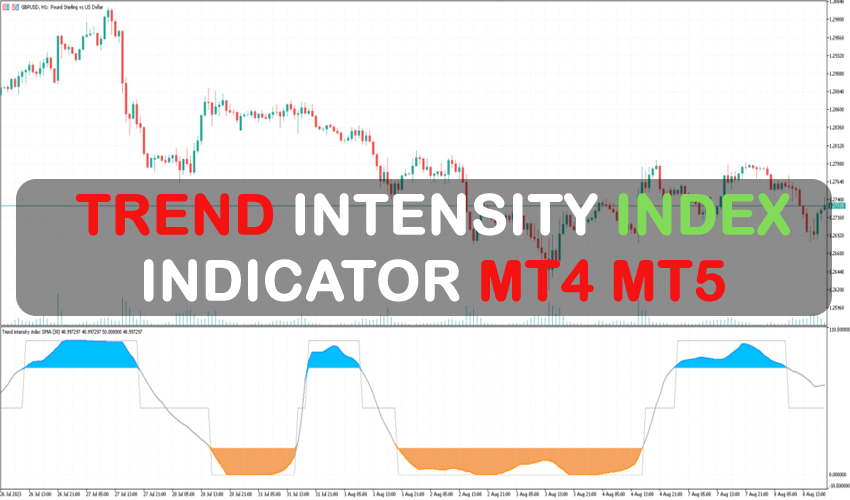
The Trend Intensity Indicator has a simple visual representation. It displays trend-based data as a colored signal line in a separate window. Here’s a quick summary:
01. Oversold Territory: A market is considered oversold if the index falls below the 20-point threshold and takes on a brown tint. Traders should search for buying opportunities in such situations. A subsequent move above the 20-point, which causes the indicator to turn gray, signals the start of an uptrend and is favorable for long positions.
02. Overbought Zone: In contrast, the market may be overbought if the signal line crosses above the 80-point threshold. The line should recede below 80 and turn gray in order to support a selling proposition.
03. Trending State: An indicator of the market’s trending nature is the gray line in the Trend Intensity Index. Traders can carefully construct their bets by contrasting the market’s inclination with the indicators of trend strength or weakness.
An investor may remain long until the index surpasses the 80 threshold and becomes blue, indicating an overbought condition, for example, if the trader decides to go long after the index crosses the 20 levels and goes gray.
| |
The Trend Intensity Index is not perfect, like every indicator. In instances where the market is consolidated or choppy, its performance may falter. As a result, traders ought to give priority to transactions that align with trend-following market circumstances.
Any Forex currency pair as well as other assets including commodities, cryptocurrencies, binary options, stock markets, indices, etc. can be used with this Trend Intensity Indicator. Additionally, you may use it on whatever time interval—from the 1-minute charts to the month charts—that works best for you.
| |
 | No Minimum Deposit ECN Acount No Commission | |
Min Deposit of 20$ |
How Trend Intensity Index Indicator Used in Forex Trading
The Trend Intensity Index Indicator (TII) in Forex trading is a useful tool for determining the direction and strength of a trend for a certain currency pair. Since the Forex market is open around-the-clock and major world economic events are significant, traders may find it essential to identify trends. In this situation, the TII is usually used as follows:
- Determining Trend Direction: An upward trend may be present if the TII is higher than zero.
- A possible downward trend is indicated if the TII is less than zero.
- Strength of the Trend: A trend that is more robust is indicated by a higher absolute TII number. A TII rating of +20, for example, might point to a more robust upswing than one of +10. On the other hand, a result of -20 rather than -10 would point to a more severe downturn.
- Entry and Exit Signals: A crossing of the TII above zero may be taken as a cue to go long or as a possible purchase signal.
- One may interpret a TII crossing below zero as an indication to go short or as a possible sell signal.
- Filtering Noise: It’s critical to remove “noise” or small fluctuations from the Forex market due to its potential for extreme volatility. This is when Trend Intensity Indicators come in handy. A trader may be able to weed out small oscillations and concentrate on larger trend movements by concentrating primarily on strong TII readings.
- Combining with additional Indicators: The Trend Intensity Index Indicator works best when used with additional tools, much like other indicators. More reliable trading signals can be obtained, for instance, by employing Fibonacci retracements, support and resistance levels, or other momentum indicators like the MACD (moving average convergence divergence) or RSI (relative strength index).
- For example, before executing a trade based on a TII signal, a trader can hold off until receiving confirmation from another indicator.
- TII gives information on the strength of a trend, but it does not provide precise levels for stop-loss or take-profit. To choose where to place these orders, a trader can use additional technical tools after utilizing TII to assess the trend’s strength and direction.
- Divergences: Just as with other momentum indicators, it might be useful to identify differences between the TII and price activity. If the price of the currency pair is rising, but the TII is not following suit, this could be a sign of waning upward momentum and an impending trend reversal.
Recall that no indicator is perfect, even though the Trend Intensity Index can be a helpful tool in a Forex trader’s toolbox. It’s critical to use it in conjunction with a more comprehensive trading plan, consider the larger market backdrop, and effectively manage risk.
| |

| |