 |
The Trix Crossover indication is an MT4/MT5 indication based on the Trix technical analysis tool, which is almost considered a classic. The TRIX Indicator, a triple exponential moving average Indicator (TEMA), has a special benefit above conventional moving averages (MAs). The TRIX is an oscillator, with its line shown in a separate window rather than directly on a candlestick chart. Through repeated swings, this unique display emphasizes the indicator’s rate of change.
The TRIX provides traders with an accurate and trustworthy viewpoint by only using price data. The indicator doesn’t repaint, which makes it a great option for scalping and intraday trading in the forex market. In order to ensure efficient and successful market analysis, traders should concentrate on timeframes between M1 and M30 for the best performance.
Any Forex currency pair as well as other assets, including commodities, cryptocurrencies, binary options, stock markets, indices, etc., can be used with this TEMA MT4. Additionally, you may apply it to any time window that works best for you, from 1-minute charts to monthly charts. Working with timeframes between M1 and M30 is advised for best use.
There are no limitations placed on this indicator by the fxssi.com website. On this website, there are many beneficial free and paid indicators. So have a look at their other indicators and give the FXSSI Indicators some love.
What is Triple Exponential Moving Average
In order to spot patterns and smooth out price fluctuations, financial analysts employ the Triple Exponential Moving Average (TEMA), a technical indicator. The classic Exponential Moving Average (EMA), a moving average that gives more weight to more recent data points, is a version of this metric.
The TEMA takes things a step further by using three different EMAs, each of which gives more weight to more recent price data. A more responsive indicator that can better follow short-term price changes while remaining robust to longer-term trends is produced as a result of the triple smoothing.
To determine the TEMA, you must first determine the single EMA for the relevant time period. Then, you take the difference between this EMA and a subsequent EMA computed over a period of twice as long. In the end, you accept the difference between these two EMAs and include it into a third EMA that was computed using three times the initial period length. The TEMA is the value that results.
The TEMA can be utilized in a variety of ways, including as a filter for other technical indicators and as a signal for initiating or quitting trades. To be effective, the TEMA must be used in conjunction with other analysis tools and risk management strategies, just like with any other technical indication.
How does the TEMA Indicator work when trading currencies?
- Detecting Trends: The TEMA Indicator can be used to determine a trend’s direction. A bullish trend is indicated by the TEMA rising, while a bearish trend is indicated by the TEMA declining. These details can be used by forex traders to place trades that follow the trend.
- Trading Signals: When TEMA passes over or under the price, trading signals may be generated. For instance, it is a positive indication when the TEMA crosses above the price, advising traders to think about opening a long position. In contrast, a bearish signal is sent when the TEMA crosses below the price, suggesting that traders should think about opening a short position.
- TEMA can be utilized as a confirmation for other technical indicators. For instance, a forex trader can utilize the TEMA to corroborate signals of overbought or oversold circumstances identified by a stochastic oscillator. The overall trend may still be bearish if the stochastic oscillator provides a buy signal while the TEMA is decreasing, therefore the trader should use caution.
- TEMA can also be used by forex traders to set stop-loss orders. In order to safeguard their gains in the event that the TEMA rises, traders can set their stop-loss orders below the TEMA. In the opposite scenario, traders might position their stop-loss orders above the TEMA to reduce their losses if the TEMA declines.
It is significant to remember that Trix Indicator, like any other technical indicator, has its limitations and has the potential to produce erroneous signals. As a result, forex traders should carefully control their risks and use TEMA in addition to other types of analysis.
| |
Features of the TRIX Crossover Indicator
Comparing it to other tools, TRIX Indicator has the following advantages:
- The fast and slow Trix lines have different periods and are computed individually.
- This 3-in-1 indicator combines three different signal analysis methods.
- The Trix histogram and additional levels improve accuracy in tracking the indicator’s movements.
- The indicator is not limited to using only exponential moving averages; it may also be used with other forms of moving averages. It is also possible to change the specifications of the bars or candlesticks used for calculations.
| |
 | No Minimum Deposit ECN Acount No Commission | |
Min Deposit of 20$ |
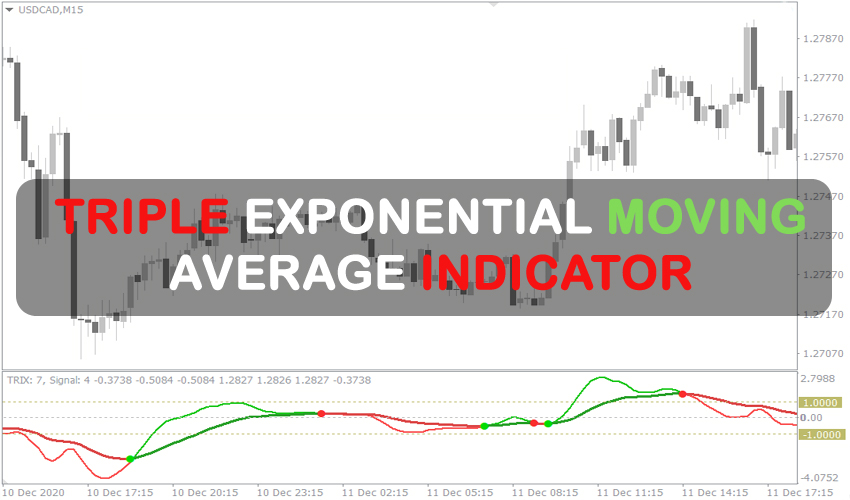
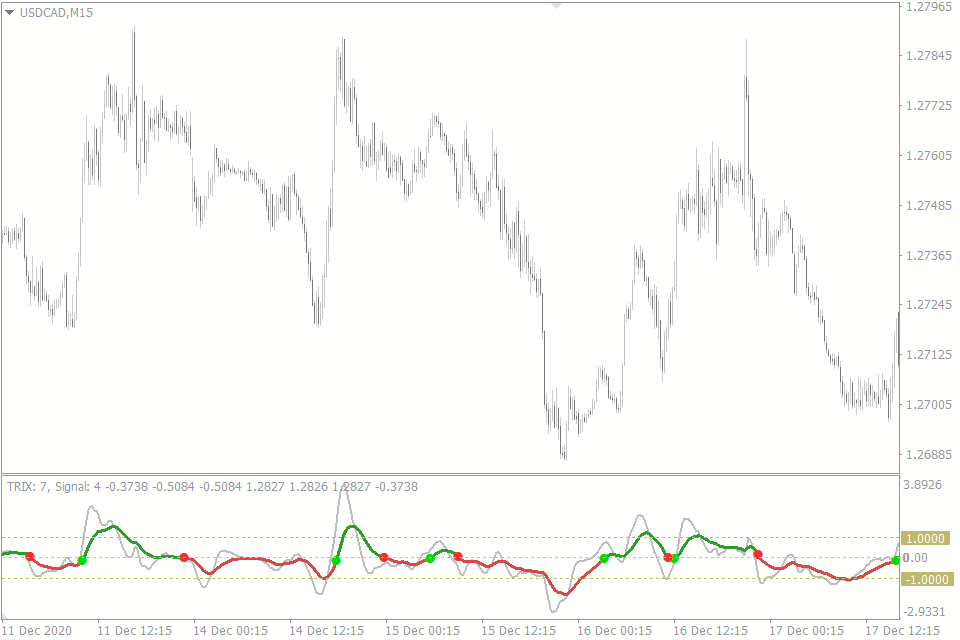
Crossover of the Trix and the signal line
A condition is considered overbought when the Trix line is above the zero line, and a condition is considered oversold when the Trix line is below the zero line.
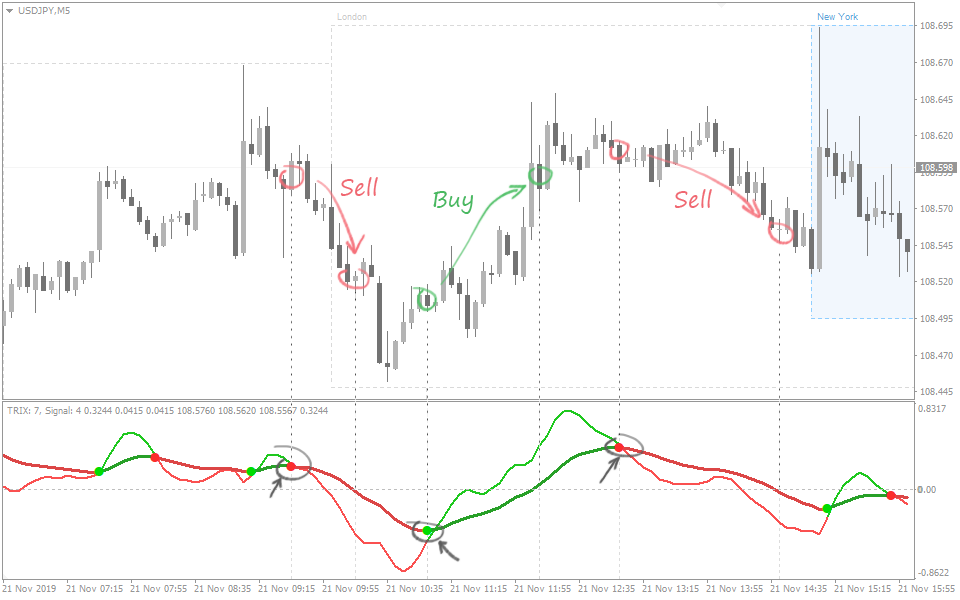
The crossover of the Trix and the signal line should be noticed in order to precisely determine the timing of the reversal:
- A Buy signal emerges when the signal line surpasses the Trix.
- A Sell signal arises when the signal line falls below the Trix.
It is a good idea to exit a trade before receiving a counter signal. When the Trix line, for example, crosses the zero line, you can decide whether to set a predetermined Take Profit size or close the position.
In these circumstances, the zero line denotes the conclusion of the momentum reversal, paving the way for the ensuing trend phase. Consequently, it is best to exit the trade if the trend’s direction is ambiguous.
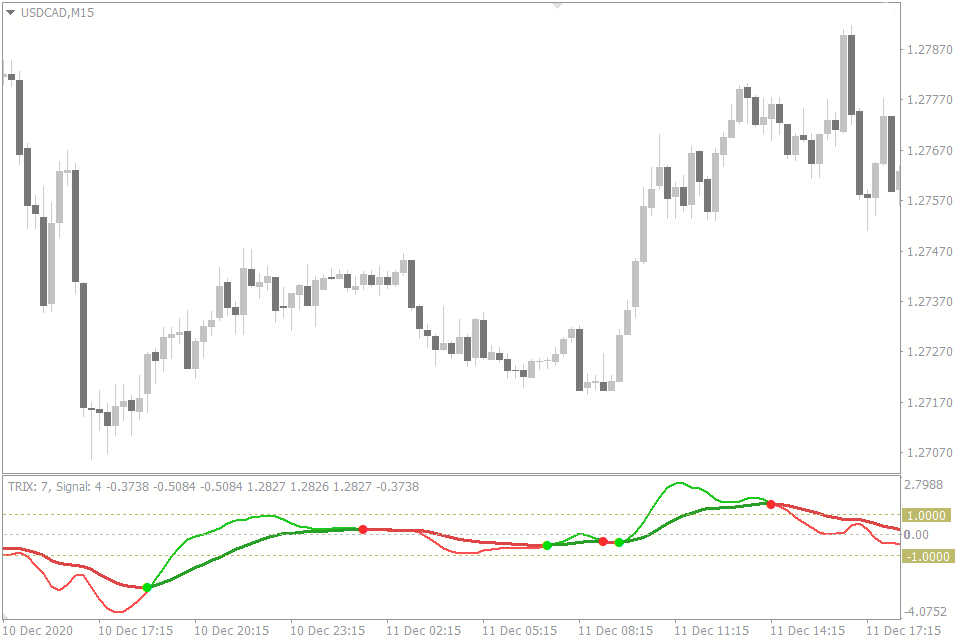
Crossover of the Trix and the zero line
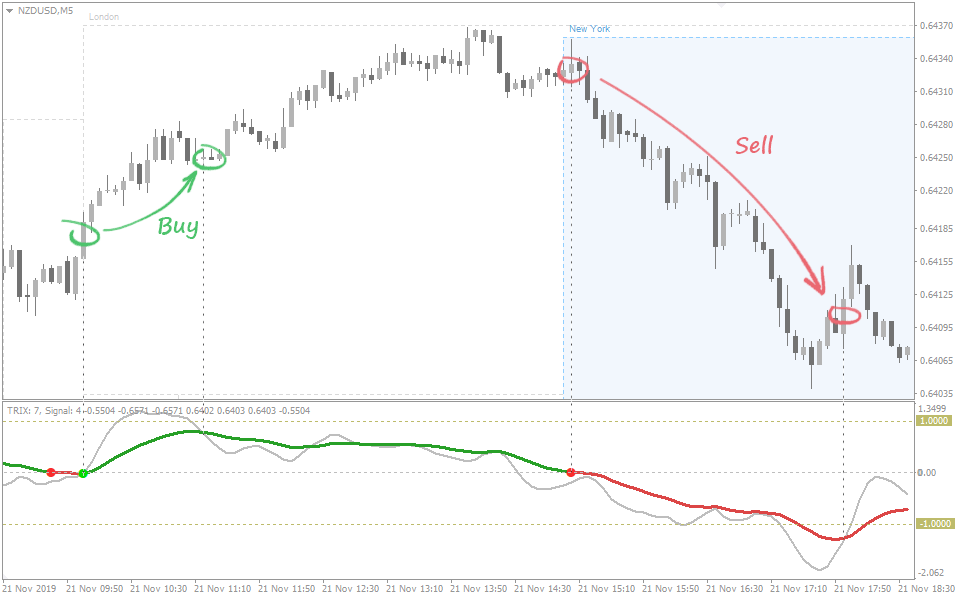
The Triple Exponential Moving Average Indicator provides a signal type that is more suited to trend trading.
When the price moves out of the flat area and there is a possibility of a new trend starting, the signal is typically generated:
- The Trix is above the zero line – Buy.
- The Trix is below the zero line – Sell.
Similar to the prior instance, a transaction should be closed before the momentum waned and the opposing indication appeared.
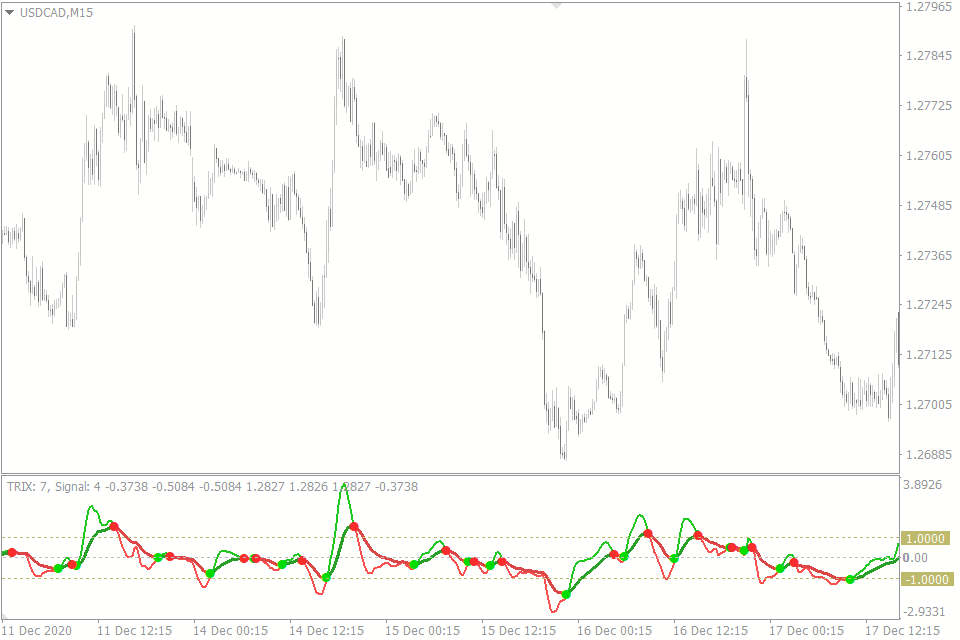
Both lines move in the same direction
In this case, spotting the coexistence of long-term and short-term trends is the main objective.
The reasoning is simple and is similar to the well-known “Elder’s Triple Screen” strategy: a trend is more likely to endure if signals agree across different timeframes.
When the Trix and the signal line move in the same direction, a signal is produced:
- When both lines ascend – a Buy signal is generated.
- When both lines descend – a Sell signal is produced.
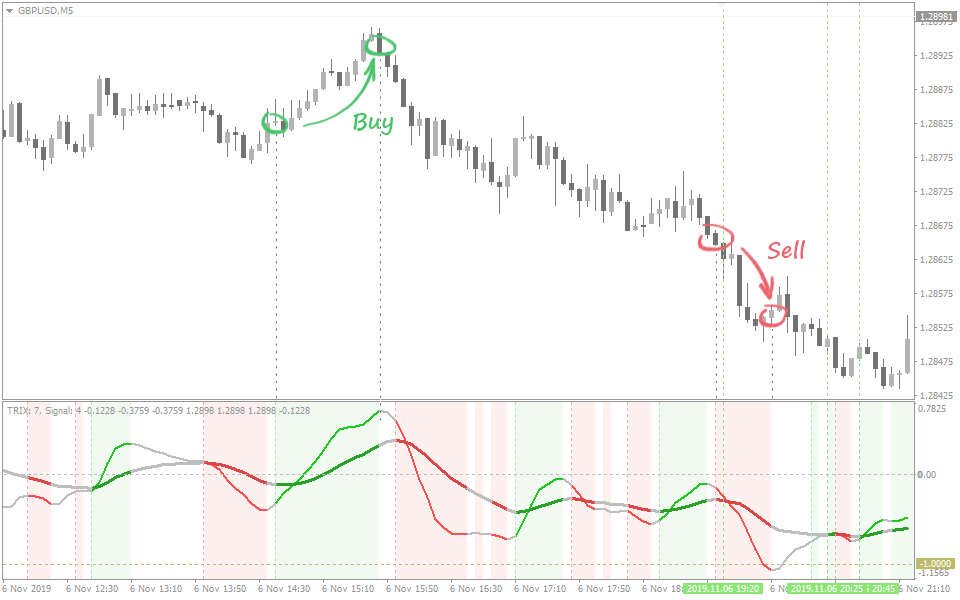
This technique successfully identifies exits. As shown in the graphic, the indicator changed to a neutral signal in time to coincide with a price reversal.
Therefore, when the lines diverge and start moving in opposite directions, a trade should be closed.
| |

| |