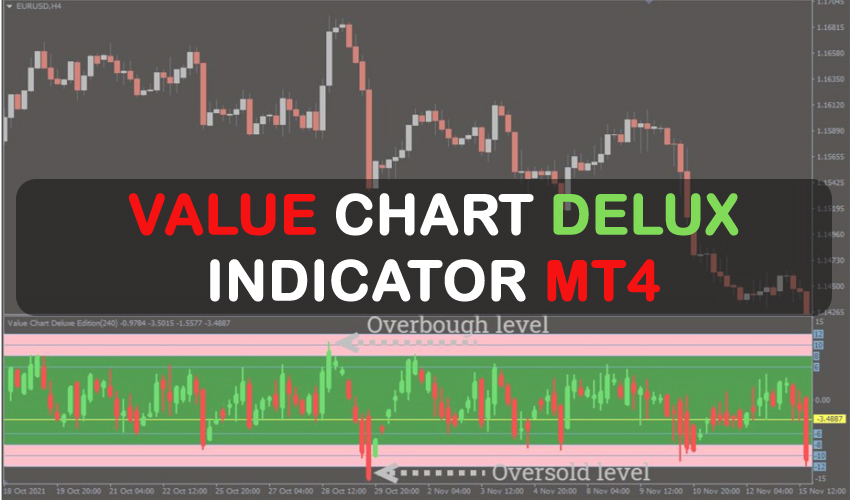
Forex traders can use the Value Chart Deluxe indicator for MetaTrader to spot ongoing market cycles. In order to assist you in identifying BUY/SELL zones, the indicator defines the highs and lows of the price action.
To show where the market value is, the MT4 indicator plots the important price turning points. It examines the state of the market at the moment and compares it with historical data on price movements.
The Value Chart Deluxe indicator can be used to quickly identify divergence, support/resistance, and overbought/oversold price regions. Reversal zones can be easily identified with the help of the indication.
Novice traders would profit from this technical indicator since it makes it simple to spot regions of market interest. It can also be used by seasoned traders as an additional layer of confirmation for trade entry, which is a recommended practice in forex trading.

After installation, the Value Chart Deluxe indicator will appear on your chart as seen in the above image. It is advised that you utilize the indication in conjunction with your regular trading strategy and indicators, not in place of them.
BUY Signal: Prioritize waiting for any indications of a potential bullish move from price action or other trading indicators. If the Value Chart Deluxe indicator’s sub-window’s candlestick is also in contact with the oversold area, then the trade is considered BUY or LONG.
SELL Signal: This situation is also covered by the same idea. Await a downward move in the price action or other trading signs. If the Value Chart Deluxe indicator’s sub-window’s candlestick is also in contact with the overbought level, then it is a SELL/SHORT signal.

