
 |
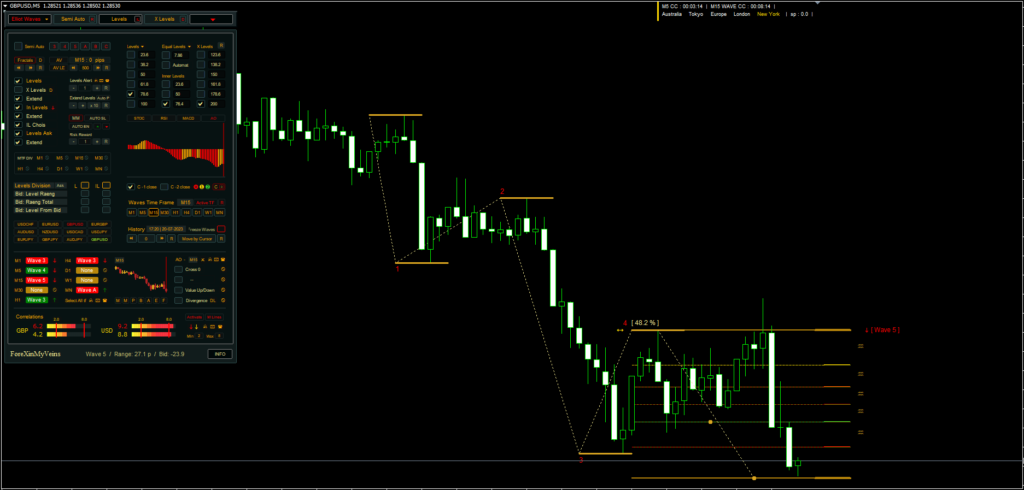
This MT4 indicator for auto-identifying Elliott waves and plotting them on the chart is called the Auto Elliott Waves Indicator. This advanced tool integrates the Elliott Waves theory into its plethora of fantastic features and high degree of customisation, making trading a smooth experience.
The Fully Automatic Waves and Semi-Automatic Waves are the two primary characteristics of the Auto Elliott Waves Indicator.
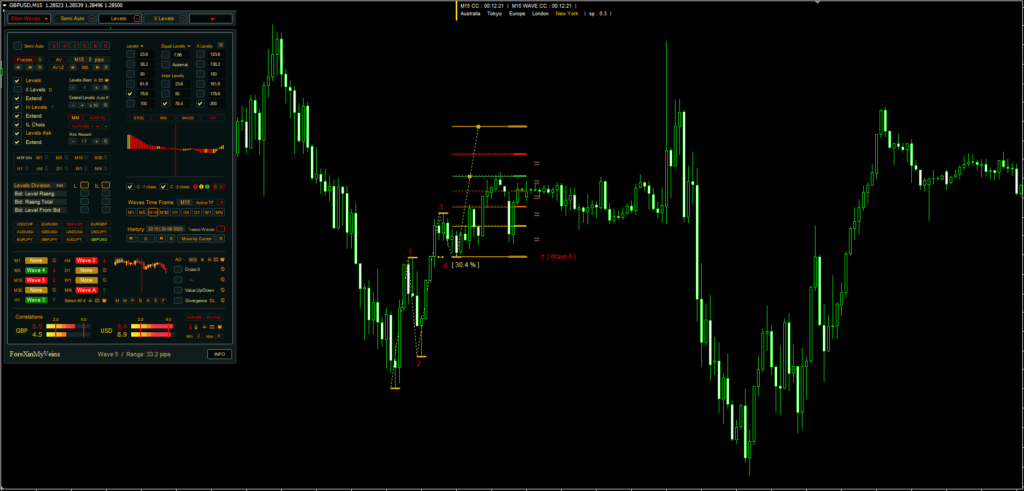
When operating in full automatic mode, the software generates wave patterns on the chart by utilizing the fractals of the chosen time interval. Traders may now concentrate more on strategy and less on technical analysis by not having to manually identify and apply the waves.
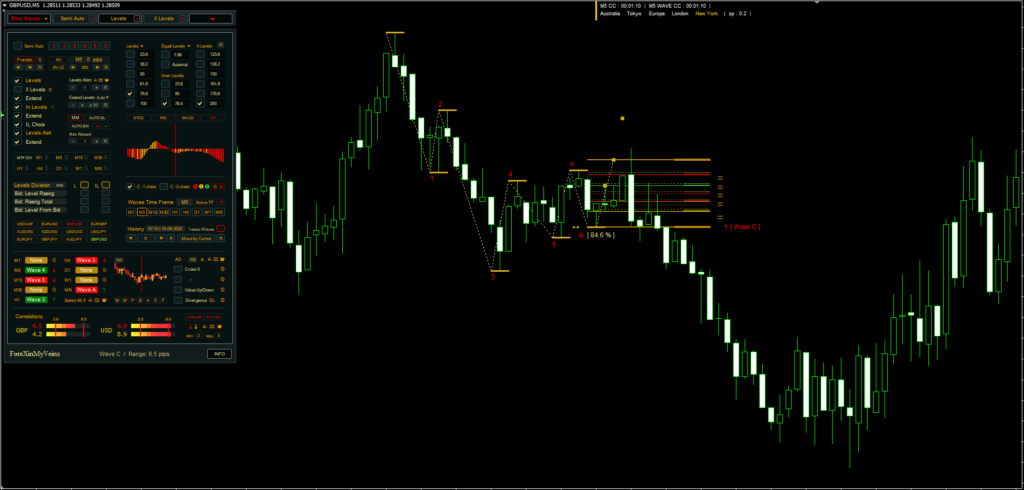
However, the semi-automatic option allows traders to manually position the waves anywhere on the chart as long as they follow the fundamental wave principles. The software helps you set waves in a way that strikes a compromise between convenience and control.
Any Forex currency pair as well as other assets like commodities, cryptocurrencies, binary options, stock markets, indices, etc., can be used with this Elliott Waves Indicator MT4. Additionally, you may use it on whatever time interval—from the 1-minute charts to the month charts—that works best for you.
What are Elliott Waves
Finance traders utilize Elliott Wave Theory, a type of technical analysis, to recognize extremes in investor psychology, price highs and lows, and other collective elements in order to evaluate financial market cycles and forecast market trends. It was established in the late 1930s by Ralph Nelson Elliott, whose thesis states that markets move in repeating cycles. He attributed this to investors’ constantly fluctuating moods, which is impacted by a variety of external causes.
Elliott suggested that investors’ responses to external factors or the prevailing societal psychology of the period cause these market cycles. He discovered that the upward and downward oscillations in mass psychology consistently manifested as the same repeated patterns, which he further subdivided into patterns he dubbed “waves.”
According to the Elliott Wave Principle, trader psychology—both optimism and pessimism—is intimately correlated with market patterns. According to the theory, there are two kinds of waves: corrective waves and impulse waves.
- Impulse Waves: In the Elliott Wave Theory, impulse waves consist of five smaller waves and move in the same direction as the trend of the next larger size. They play a key role in the overall pattern, creating a ‘net’ movement in the same direction as the larger trend.
- Corrective Waves: Corrective waves, on the other hand, consist of three smaller waves and move against the trend of the next larger size. These waves illustrate the periods in the market where the trend ‘corrects’ itself.
An entire cycle of eight waves is formed when the impulse and corrective waves are combined. The hypothesis also suggests that these eight-wave cycles are a component of more extensive patterns. The cycle never ends, and traders can forecast future price fluctuations by knowing where the market stands in relation to this cycle.
It’s important to remember that although Elliott Wave theory can offer a broad indication of a market’s potential direction, it’s not always regarded as an accurate timing method. However, for the purpose of organizing trading tactics and conducting market research, traders and analysts use it extensively.
How it used in Forex Trading
Forex traders frequently utilize Elliott Wave Theory as a tool for strategic planning and market analysis. The theory’s focus on wave cycles helps forecast price movement by highlighting price highs and lows as well as market extremes in investor emotions. This is how it’s used in foreign exchange trading:
- Finding Market Cycles and Trends: Determining whether the market is trending or moving sideways is the first stage in this process. Examining the bigger daily, weekly, or monthly period charts will help you do this. According to Elliott Wave Theory, market movements follow a 5–3 wave pattern, where a trend is represented by the 5-wave pattern (Impulse Waves) and a countertrend or consolidation period is represented by the 3-wave pattern (Corrective Waves).
- Predicting Future Price Movements: By recognizing these wave patterns, traders can make predictions about future price movements. For example, a trader may forecast a 3-wave corrective pattern to occur if they determine that the market has finished a 5-wave impulse pattern. On the other hand, a trader may anticipate the completion of a fresh 5-wave impulse pattern if a 3-wave corrective pattern
- Elliott Waves are also useful for figuring out possible entrance and departure locations. For instance, a trader may open a position to capture the expected counter-trend 3-wave pattern if they see that a 5-wave pattern is almost complete. Similar to this, a trader who is expecting a counter-trend reversal may choose to exit or take a profit following a 5-wave pattern.
- Risk Control: The notion is applied to risk management as well. For instance, a trader knows their analysis was flawed and it’s probably time to abandon the trade if they initiate a position expecting a 3-wave corrective but the price breaks past the beginning of the previous impulse wave—something that should never happen in theory.
| |
Elliott Wave Theory is a useful tool, but it’s vital to remember that it’s also complicated and open to individual interpretation. It also doesn’t guarantee results, just like any trading strategy. It should be used by traders in conjunction with fundamental analysis, other technical analysis tools, and sensible money management techniques.
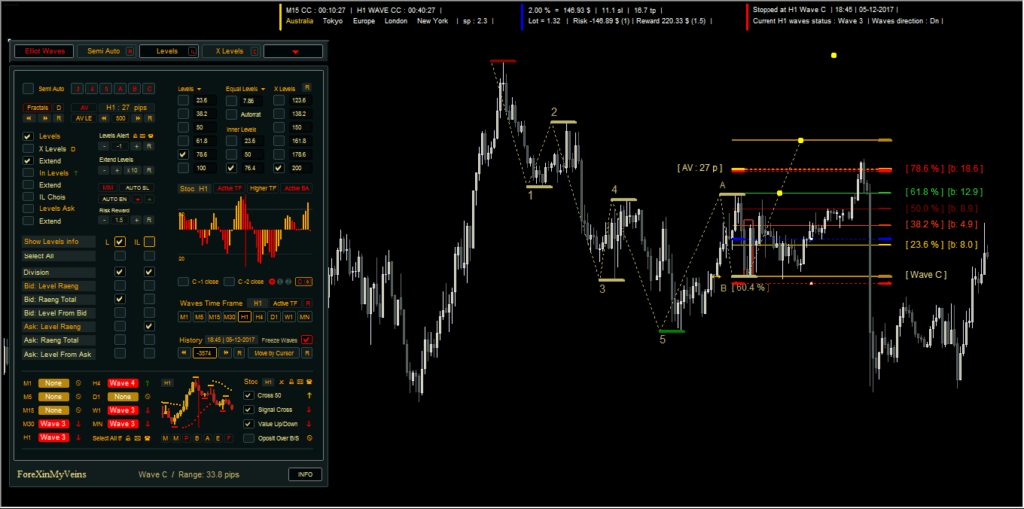
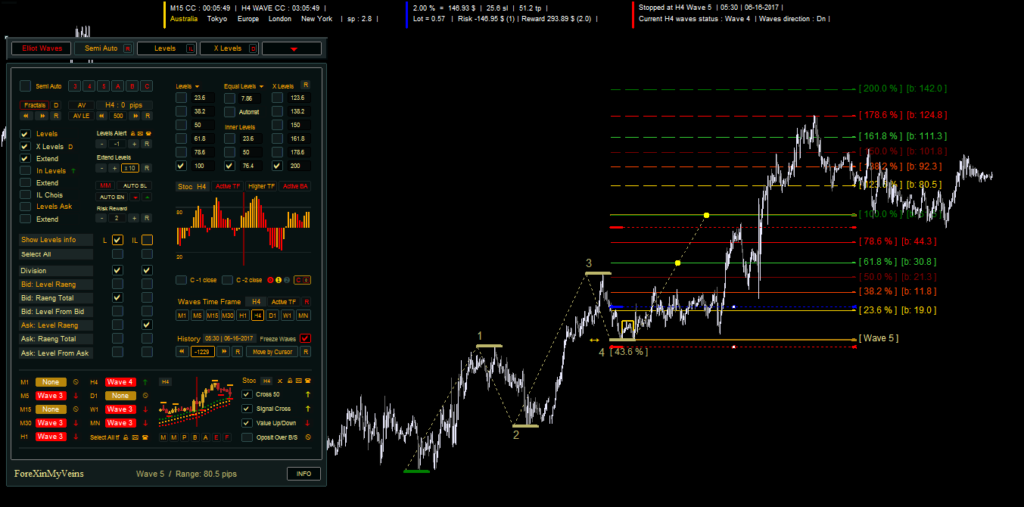
Dashboard Flexibility & Input Customization in Elliott Waves Indicator
The Elliott Waves Indicator’s exceptional customizability is one of its most notable qualities. With the software’s more than 100 programmable input parameters, traders may precisely match the system’s functions to their own trading approaches and risk tolerances. This covers wave positioning, money management configurations, oscillators, and more.
Elliott Waves Indicator also has a feature-rich, easily navigable dashboard that can be customized, making it a powerful trading tool. Users have the ability to customize alert systems, change the dashboard’s style, and choose which data to show. This guarantees a customized trading environment intended to maximize trading profitability and efficiency.
| |
 | No Minimum Deposit ECN Acount No Commission | |
Min Deposit of 20$ |
Features of Auto Elliott Waves Indicator
- Automated Money Management: By automatically calculating the risk-reward ratio for your investments, the software promotes risk-aware and disciplined trading.
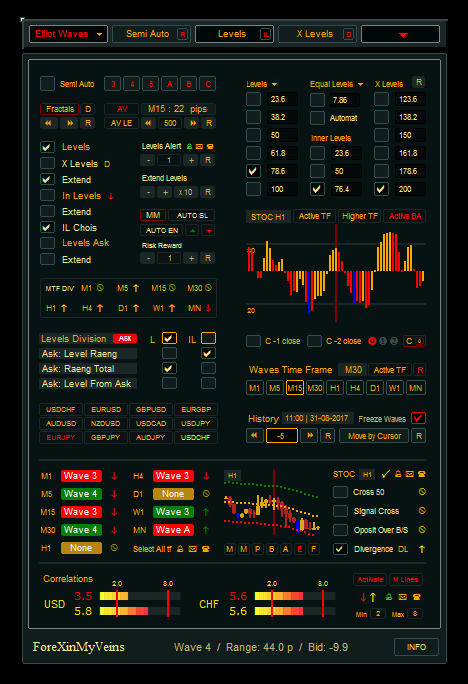
- Display of Multiple Time Frames and Currencies: It provides a multi-timeframe and multi-currency wave display with alarm capabilities. From the panel, traders may quickly change the currency and time frame of the chart.
- Mini charts with a wide view: The Elliott Waves Indicator offers mini charts with a wide view of trading that include Candlesticks, Moving Averages (MAs), Fractals, Average True Range (ATR), Envelopes, Parabolic Stop and Reverse (PSAR), and Bollinger bands.
- Divergence-Oscillators: The software offers multi-time frame divergence and signaling with choices among four oscillators: stochastic, RSI, MACD, or AO.
- The recently introduced function of Automatic Correlations Strength helps determine how closely different trading pairs are correlated.
- Fibonacci Levels with Trading Levels: Fibonacci levels can be created and trading levels can be divided by percentages, conventional division, or pip values with Auto Elliott Waves.
- Average Price Movement: To help with precise price movement forecasts, this innovative function computes the average price movement between fractal highs and lows of up to 1000 candles earlier in the wave’s time frame.
- Internal Trading Levels: For every primary trading level, it offers an internal level.
| |

| |