 |
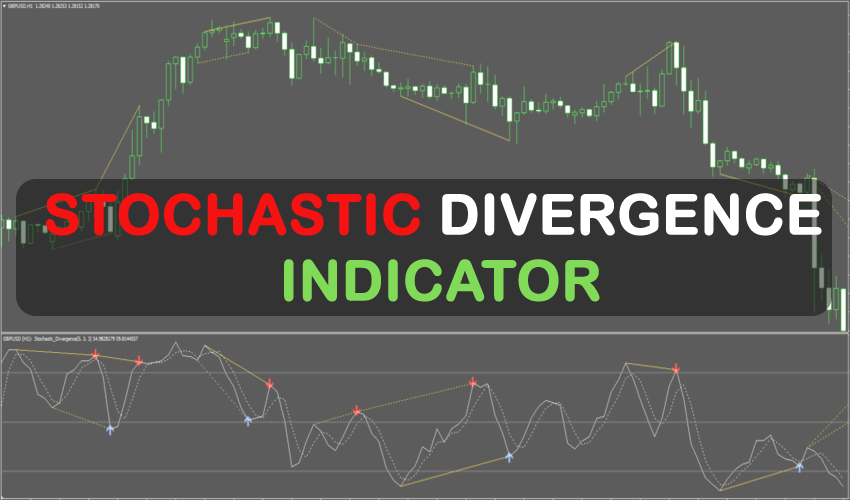
An MT4 indicator called the stochastic divergence indicator is made to automatically identify stochastic divergences in MT4. Strong reversals in market trends can be detected by it, which is a necessary component of profitable trading.
This indicator is unique in that it can automatically identify divergences, a task that is sometimes difficult and time-consuming to complete manually. The SDI helps traders identify potential trend reversals by highlighting countermovements between the price and the Stochastics by creating trendlines on the price chart and the indicator window.
The SDI improves this simple strategy by highlighting bullish or bearish divergences with visual arrow alerts. This feature makes it easier to predict price reversals, which is very useful for novice and seasoned traders. The SDI’s ability to find and detect divergences within a certain timeframe is another impressive capability.
The SDI offers the ability to show arrows on the chart that match detected divergences, providing an even more thorough insight of market patterns. With the help of this simple visual tool, monitoring and evaluating market trends is easier to do.
The SDI is made to facilitate thorough market analysis, allowing traders to assess the efficacy of divergences in the market of their choice. Because of its flexibility in adjusting to the chosen timeframe, traders can tailor their divergence searches to their own unique methods. Because of its flexibility, the SDI is a tool that may be used for a variety of trading strategies, including day trading and scaling.
It can be configured to send you an email and pop-up notifications on the platform. This is useful since it allows you to monitor numerous charts at once and eliminates the need for you to spend the entire day staring at the charts while you wait for signals to appear.
Any Forex currency pair as well as other assets including commodities, cryptocurrencies, binary options, stock markets, indices, etc. can be used with this stochastic indicator. Additionally, you may use it on whatever time interval—from the 1-minute charts to the month charts—that works best for you.
There is more to this divergence indication than just a trading indicator system. Nonetheless, it can be a great asset to your trading as a tool for further chart research, determining the trade exit position (TP/SL), and more. Although this technique is accessible to traders of all skill levels, it can be helpful to practice on an MT4 demo account until you have the consistency and self-assurance necessary to move on to actual trading. With most Forex firms, you can open a genuine or demo trading account.
| |
Technical analysts use the term “stochastic divergence” to describe the difference between an asset’s price behavior and the Stochastic Oscillator indicator. When applied properly, this divergence can be an effective tool for spotting possible reversals in the prevailing trend.
A momentum indicator that displays a security’s closing price in relation to its price range over a given time frame is the stochastic oscillator. The indicator swings between 0 and 100; values below 20 indicate an oversale and values above 80 indicate an overbuy.
When examining stochastic divergence, traders and analysts search for situations in which the stochastic oscillator and asset price are not going in the same direction. Two main categories of stochastic divergence exist:
- Regular, or Classic, Divergence: This is the situation where an asset’s price is rising while the Stochastic Oscillator is falling (bearish divergence) or rising when the asset’s price is falling but the Stochastic Oscillator is rising (bullish divergence). Usually, regular divergence is interpreted as an indication of an impending trend reversal.
- Bearish hidden divergence, or higher lows accompanied by lower lows made by the Stochastic Oscillator, is one form of hidden divergence that happens when an asset’s price is making lower highs while the Stochastic Oscillator is making higher highs (bullish hidden divergence). Usually, hidden divergence is interpreted as a continuance of trend signal.
Stochastic Divergence is not infallible, but it can be an effective tool for spotting probable trend continuations or reversals. To validate signals and lower the possibility of false positives, it ought to be used in conjunction with additional technical analysis tools and indicators.
How is it used in Forex Trading
Stochastic Divergence is a popular technical indicator in forex trading, just like a lot of other indicators. With the use of this tool, traders can more accurately time their transactions by identifying possible trend reversals or continuations.
This is how it could be applied to forex trading:
- How to Spot Regular Divergence: A trend reversal may be indicated by regular (or classical) stochastic divergence. A potential bearish trend reversal is indicated by a lower high made by the Stochastic Oscillator while the price is rising (bearish divergence). In contrast, if the Stochastic Oscillator creates a higher low while the price recording a lower low, this could suggest a potential positive reversal (bullish divergence).
- Finding Hidden Divergence: A hidden stochastic divergence can indicate that a trend is likely to continue. A concealed bearish divergence is indicated by a lower price and a greater high in the stochastic oscillator (suggesting the continuation of a decline). Similar to this, a concealed bullish divergence (suggesting the continuance of an uptrend) is indicated by a higher price and a lower low in the Stochastic Oscillator.
- Stochastic divergence signals are used by traders to time the entry and exit of their transactions. For example, a trader may choose to open a short position and wait for the price to drop after spotting a bearish divergence. Similar to this, a bullish divergence may indicate that the time is right to open a long position in anticipation of a price increase.
- Verification of Additional Signals: Stochastic divergence is frequently used to verify other signals in conjunction with additional technical analysis instruments. For instance, if a trader notices a bearish divergence during an upswing, they might hold off on making a trade until they see a bearish candlestick pattern or a break of a resistance level, which would confirm the trend reversal.
- Risk management: By assisting traders in placing stop-loss orders, stochastic divergence can also be utilized to reduce risk. In the event of a bullish divergence, a trader may set a stop loss just below the recent low or just above the recent high.
Note that although stochastic divergence is a useful tool, it is not perfect. Since there could be false signals, it’s critical to take into account additional market variables and use risk management techniques. Making better trading decisions in the forex market can be greatly improved by utilizing this tool in conjunction with a thorough, well-rounded trading strategy.
| |
 | No Minimum Deposit ECN Acount No Commission | |
Min Deposit of 20$ |
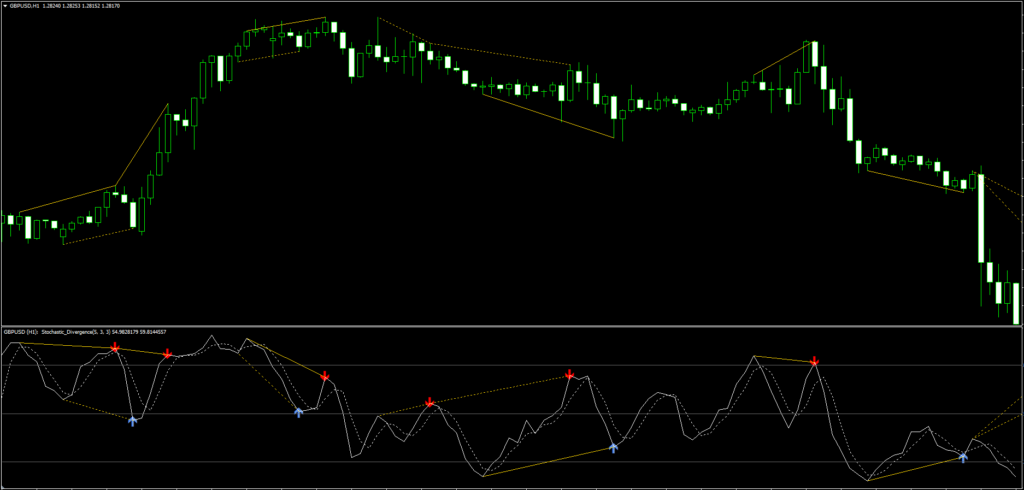
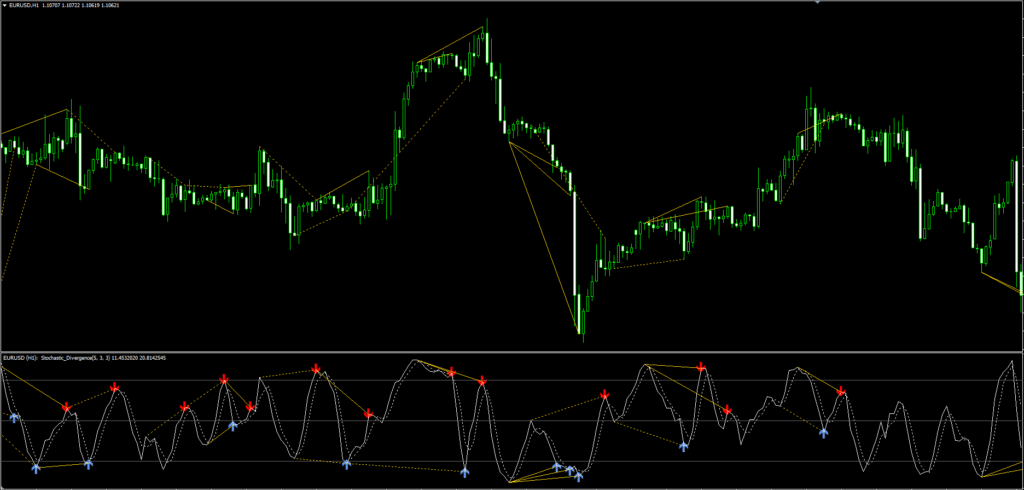
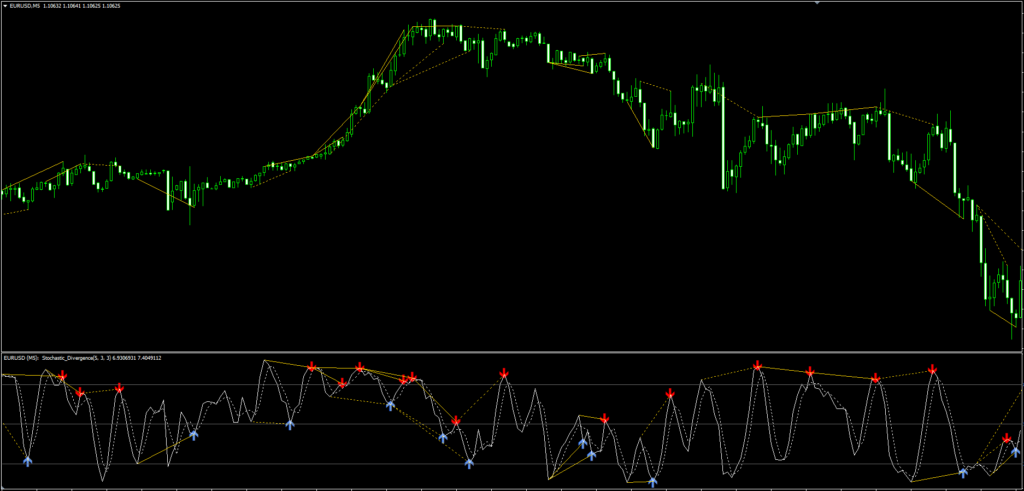
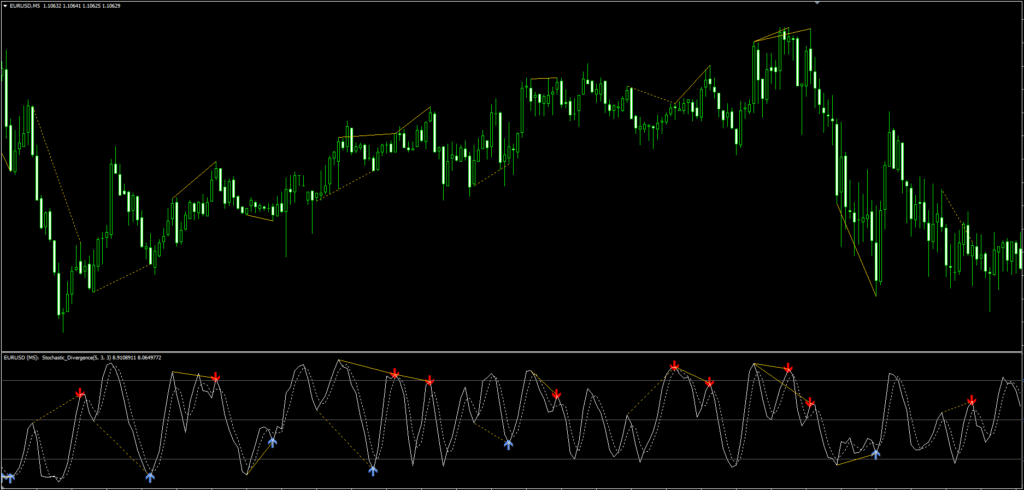
In the language of trading, a divergence occurs when the Stochastics and price movement diverge. When price makes a lower low and the Stochastics show a higher low, for example, this difference is called a bullish divergence. This bullish divergence is indicated in the Stochastic Divergence Indicator window by an upward-pointing blue arrow.
In contrast, a bearish divergence happens when the price reaches a higher high and the Stochastics charts a lower high. A red arrow on the indicator window heading downhill indicates this opposing movement.
| |

| |