 |
Sadly, there isn’t an indicator on the MT4 terminal that can evaluate the relative strengths (or power) of different currencies. An open-source Currency Strength Meter was created in order to address this issue. We’ll introduce you to the indication in this article.
Contents:
- Description
- Features
- How to use
- Conclusions
Description
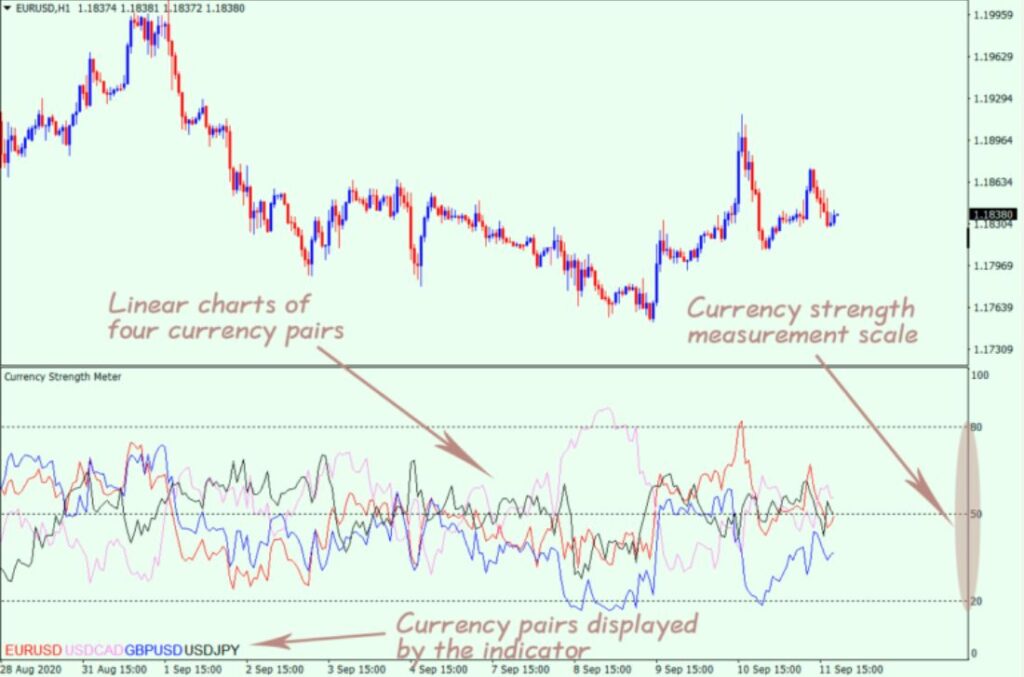
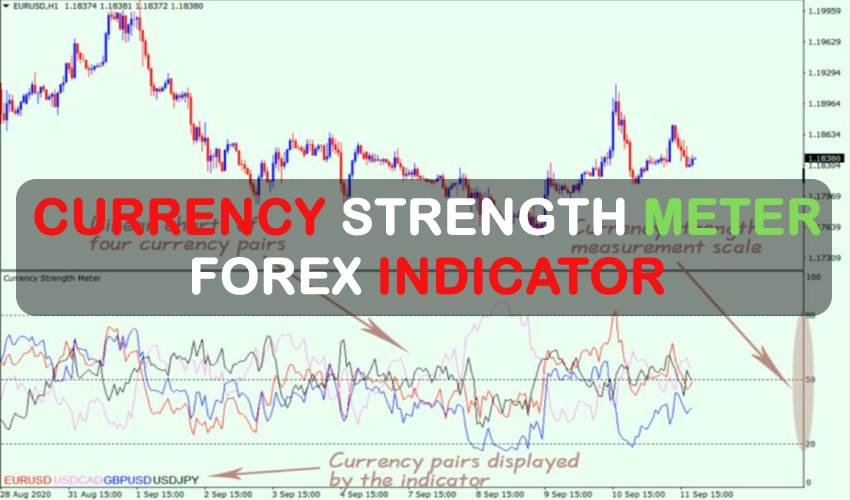
The CurrencyStrengthMeter indicator, also known as the currency strength meter or meter, creates four live currency pair charts and shows the relative strengths of the currencies. Financial instrument ticker symbols are shown in the indicator’s window’s lower-left corner. The colors of the symbols in the indicator window correspond to the color of the chart. Values ranging from 0 to 100 are represented on the vertically oriented currency strength measurement scale.
When two currencies are mentioned, the base currency is quoted first and the quote currency is quoted second. In the case EUR/USD, the USD would be the quote currency and the EUR the base currency.
The base currency is stronger and the quote currency is weaker (upward trend) when the chart approaches 100. It makes sense to consider the market’s overall perspective. It is therefore advisable to hold off until more stable purchasing conditions if the indication points to an upward trend but the growing price movement is sluggish and uninspiring.
In the opposite scenario, the quote currency is stronger and the base currency is weaker (downward trend) the closer the chart gets to 0.
The charts show that there is no discernible trend and the currency strengths are about equal when they approach 50.
| |
Equation Strength Meter Features
“Correlation” is a term commonly used in currency strength analyses. Regretfully, there isn’t an indicator on the MetaTrader 4 terminal that can determine this parameter’s value.
A coefficient that expresses the strength of the unidirectional or multidirectional movement of currencies is called correlation (dependence). It can be both direct (trends going in the same direction) and inverse (trends going in different directions).
The leading financial websites frequently publish the specified parameter online. On the other hand, you can track this dependence right in the indicator’s window thanks to the CurrencyStrengthMeter’s built-in currency strength measuring scale.
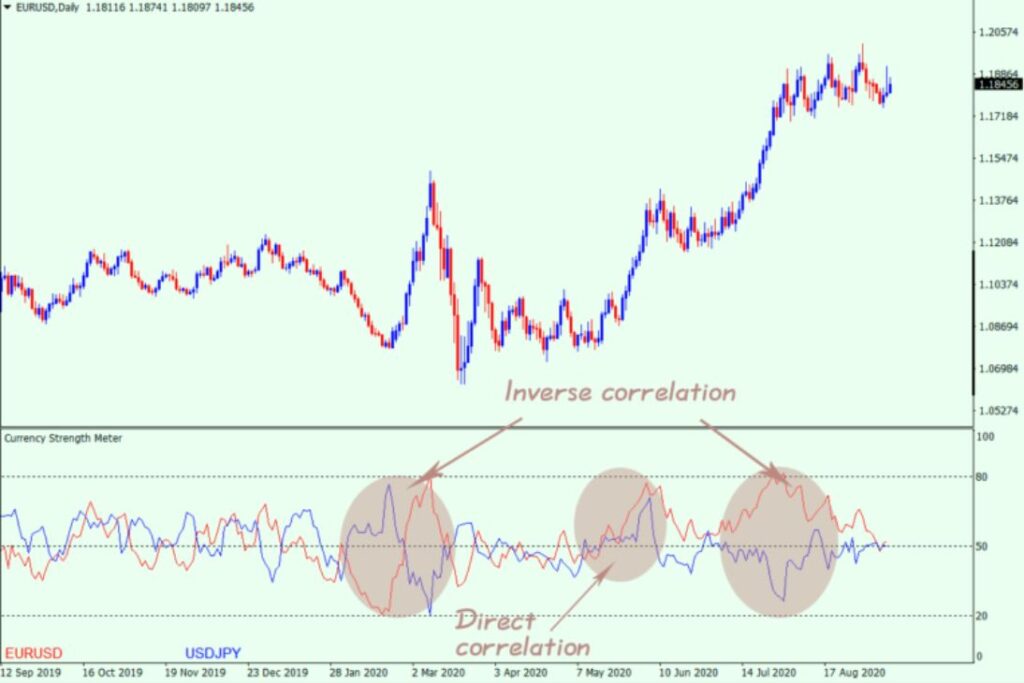
The currency pairings’ charts, like the one above, show an inverse correlation; this is demonstrated by the fact that they are close to the 20 and 80 points on the currency strength measuring scale.
Regarding the third scenario, there appears to be a direct association as both currency pairings are moving in the same direction.
As a result, you can use the CurrencyStrengthMeter indicator to determine in real-time which currency is most sought after by FX market players and utilize that information to formulate your trading strategy.
| |
 | No Minimum Deposit ECN Acount No Commission | |
Min Deposit of 20$ |
How to use
The indicator offers a shared understanding of market positioning for the examined currency pairs, but it does not produce trade opening indications.
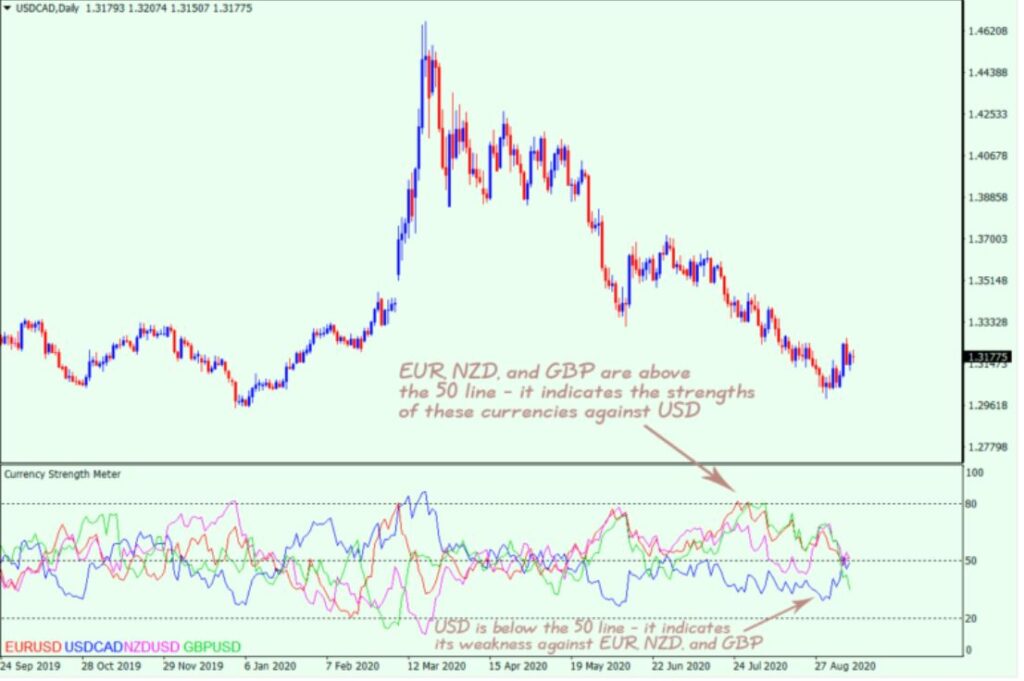
The EUR/USD, GBP/USD, and NZD/USD currency pairs are all above 50, as this illustration demonstrates. This indicates the relative strengths of the EUR, GBP, and NZD versus the USD.
The USD/CAD chart, which is moving parallel to the pairs mentioned above, is below the 50 mark, indicating a weak USD versus a strong CAD.
As a result, when compared to the other currencies listed above, the USD is weakest. You may more effectively plan your Forex trading if you keep this conclusion in mind.
Timeframes should be prioritized when utilizing this digital product. On long timeframes, there is a greater likelihood of making lucrative transactions. It accomplishes this by lessening market noise. Theoretically, there will be fewer access points throughout this time period.
Conversely, a smaller timeframe can provide more entry possibilities, but the high volatility might degrade the quality of trading signals.
Conclusions
Using four charts at once seems too hard at first glance.
This small drawback can be avoided by selecting fewer charts to be created or altering the way they are visualized (line thickness and style).
when all, you’ll rapidly become accustomed to the indicator and see its useful advantages in your trading strategy when you adjust and experiment with it.
| |

| |