 |
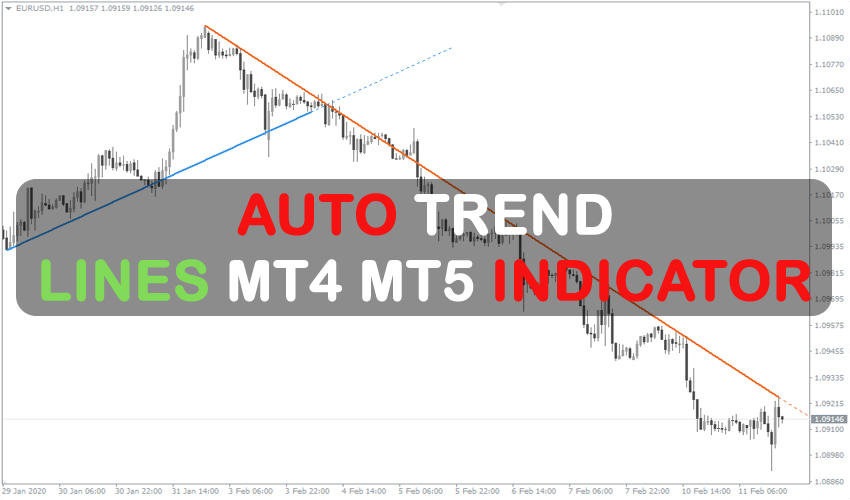
This Auto Trend Lines Forex Indicator finds the most precise trend lines and automatically puts them on the chart for MT4 or MT5. One of the most common forex market analyses employed by thousands of traders worldwide is the usage of trend lines. I wanted to share this with other traders because I personally use this indicator for my trading.
If you frequently use trend lines in your day-to-day trading, the provided indicator will make working with them much simpler and eliminate the need for you to manually locate and create the lines each time.
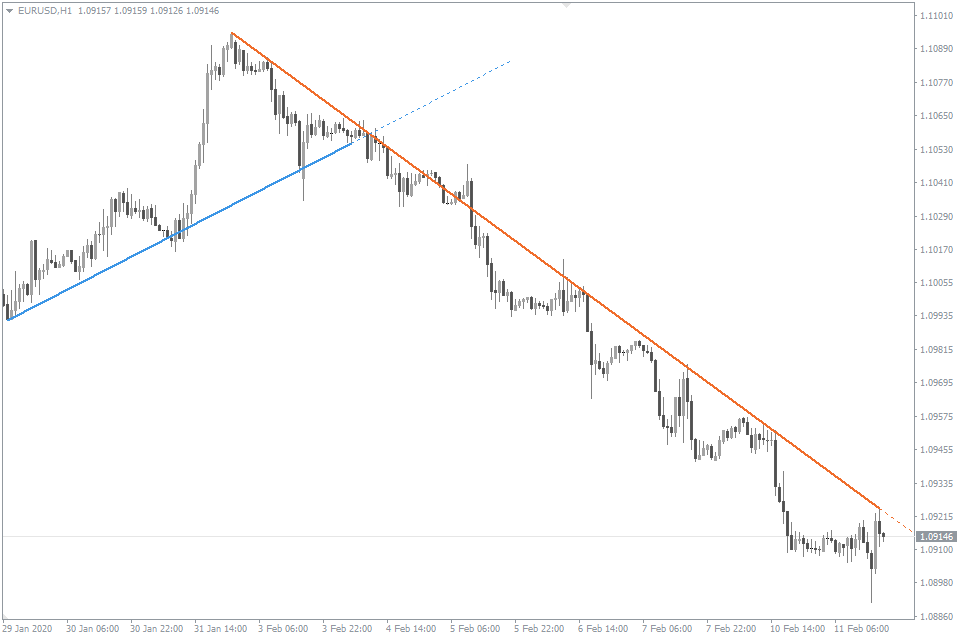
Only the most accurate trend lines are shown by the Auto Trend Lines Indicator. Therefore, if the line’s interaction with the price is no longer anticipated, it will be deleted from the chart.
When fresh extremes occur, the indicator doesn’t redraw, but it can alter the angle of the lines. It works best for short- and medium-term Forex trading.
Any Forex currency pair as well as other assets including commodities, cryptocurrencies, binary options, stock markets, indices, etc. can be traded with this AutoTrendLines indicator. Additionally, you may apply it to any time window that works best for you, from 1-minute charts to monthly charts. M15-H1 are the best times to work with.
There are no limitations placed on this indicator by the fxssi.com website. On this page, you can find additional helpful free and paid indications. Check out their other indicators and give the FXSSI Indicators some love.
What is Trend lines
A trend line is a simple straight line that joins two or more price points and is used to determine the direction of the market’s current trend. It is a straightforward yet effective technical analysis tool that aids traders in understanding the direction of the market and locating probable buying and selling opportunities. Typically, trend lines are drawn on charts to connect a sequence of highs or lows, making it simple to determine the trend’s direction.
Two categories of trend lines exist:
- Uptrend line: Connects the lows of the price action and is used to identify an uptrend.
- Downtrend line: Connects the highs of the price action and is used to identify a downtrend.
A possible signal of a trend change is a break above or below the trend line. To identify a potential trading opportunity, traders will frequently watch for a price to break above or below a trend line.
How it used
Trend lines are a technical analysis tool used in forex trading to determine the market’s direction and forecast future price movements. Trend lines can be used to determine an uptrend or downtrend by connecting two or more price points, which can assist traders in deciding when to enter or quit deals.
For instance, a trader may decide to buy a currency pair if they spot an uptrend line on a currency pair’s price chart and interpret this as a bullish indicator. Similar to how a downtrend line can be seen as a bearish indicator, a trader may decide to sell a currency pair if they see one.
Trend lines are often utilized by traders to spot probable regions of support and resistance that can be used as trade entry and exit points. A trader might view an approaching uptrend line on a currency pair as potential resistance and look to take profits or close out a long position at that point, for instance, if the currency pair is trending upwards.
In order to make a more educated decision, trend lines should be used in conjunction with other technical analysis tools like candlestick patterns and indicators. This is because trend lines by themselves might not provide a complete picture of the market.
| |
Whom is Auto TrendLines indicator for?
In technical analysis, trend lines (TL) are a straightforward yet effective tool that may be used to spot trends and forecast future price movements in the currency market. Both inexperienced and seasoned traders can utilize them, and they work with any indication and trading strategy.
While experienced traders can use the AutoTrendLines to quickly discover trend line possibilities and save time in their analysis, novice traders can utilize trend lines to learn about market patterns and how to create trend lines on their own.
The methods listed below will assist traders in properly analyzing trend lines and incorporating them into their trading strategies.
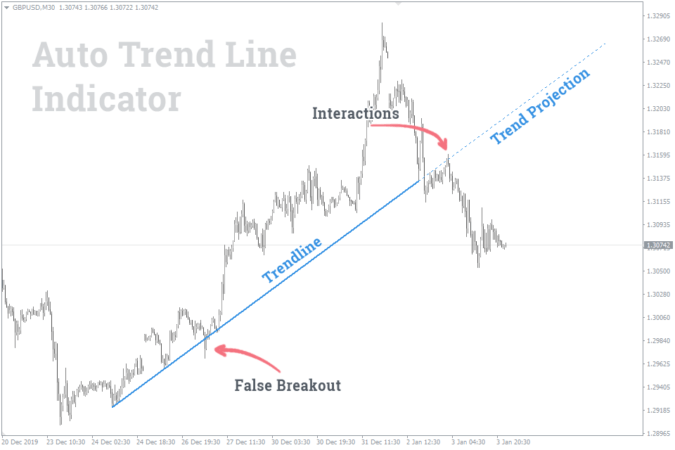
How Does the AutoTrendLines Indicator Draw Trend Lines?
A chart’s possible trend lines can be found with the Auto TrendLines indicator. It begins by locating all potential trend lines, and then applies filters to weed out those that don’t match a set of requirements. The two best trend lines are then selected from the remaining lines and shown on the chart.
Thus, there can only be two lines on the chart at the same time:
- Uptrend line (blue);
- Downtrend line (orange).
Trend Projection
The dotted lines show potential locations of interaction between the price and the trend line as well as the indicated direction of the trend continuance, while the solid line shows the trend line that the Auto Trend Lines Indicator was able to identify. Trend projection is another name for the dotted line.
| |
 | No Minimum Deposit ECN Acount No Commission | |
Min Deposit of 20$ |
How to trade using the Auto Trend Lines Indicator?
Trading with trend lines can be broken down into two main methods:
- Price bounce (reversal) from trend line;
- Trend line breakout.
Rarely, trend lines are used as the price movement vector.
Price bounce (reversal) from trend line
The idea that trading with the trend is the most effective must have been voiced to you pretty frequently. This method is predicated on the notion that asset prices often follow trends, making trend reversals less likely.
The next time, when the price touches the trend line, it is better to open a trade in accordance with the rationale presented above. By doing this, you’ll also receive the best reward to risk ratio for a trade that has a good chance of paying off.
The strategy of ““Price bounce from TL” implies,
- Buy if the price has approached or touched the uptrend line;
- Sell if the price has approached or touched the downtrend line.
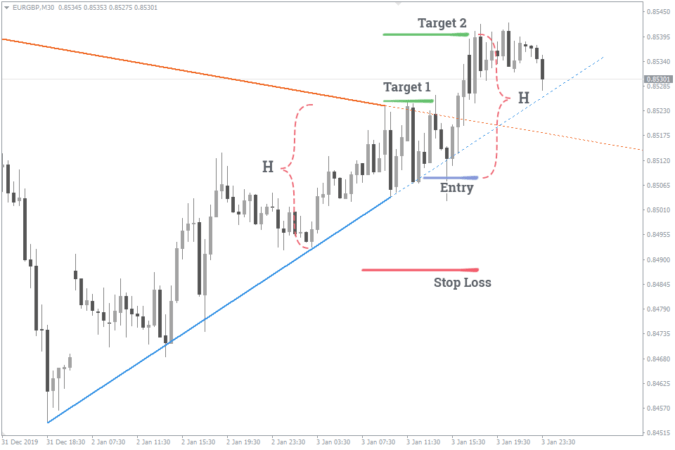
To avoid a false breakout, it is advised to put stop-loss orders over or under the previous low by a certain amount of points. Take profits can be set at either the lowest/highest price level that falls within the trend line’s range or at a distance that corresponds to the height of the previous wave.
Trend line breakout
All trend lines will eventually break, but traders may still profit from this scenario by employing this trading approach when a trend line breaks out. The foundation of this technique is the notion that when a trend line is broken, it may signal a shift in the market’s direction and a chance for profit.
- If the downtrend line has been broken, and the price has settled above it, you should consider buying if the price also touches the line again from the other side.
- If the uptrend line has been broken, and the price has settled below it, you should consider selling if the price also touches the line again from the other side.
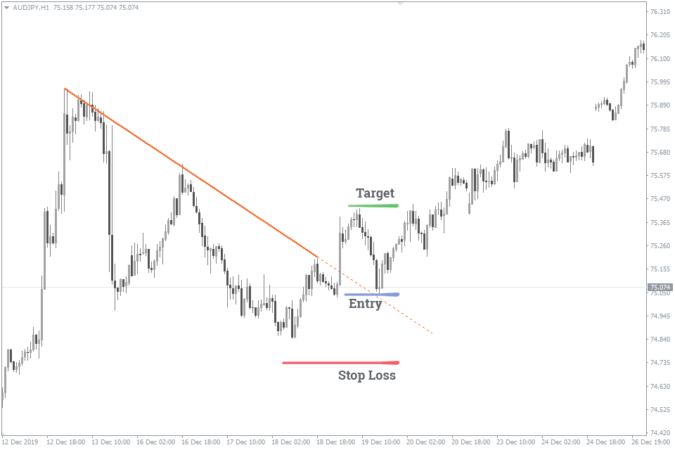
The idea for putting stop-loss and take-profit orders when utilizing both approaches is similar. For a buy trade, the take-profit order should be put at the level of the highest price reached at the time the trend line broke. The stop-loss order should be placed below the lowest price level within the range of the analyzed trend line. The same reasoning, although in reverse, also applies to sell trades.
| |

| |