 |
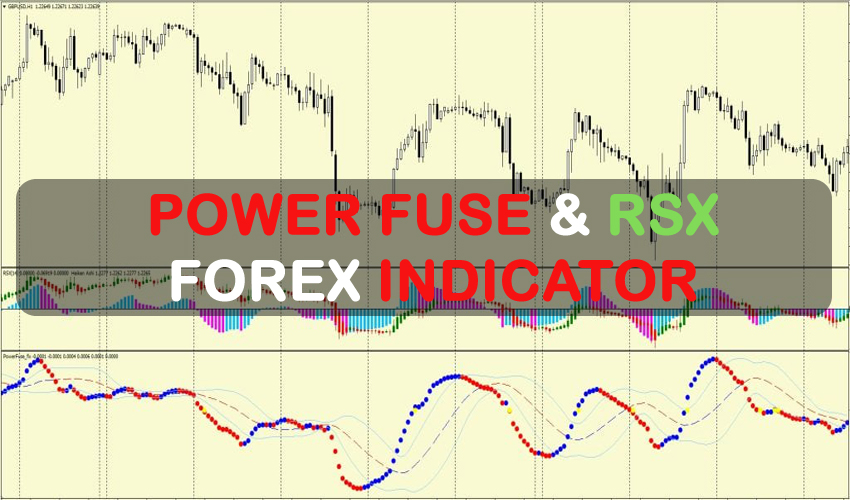
The Bollinger Bands and MACD indicators are combined into the Power Fuse RSX Forex Trading System, a hybrid technical indicator that is presented in a separate window beneath the price chart. Any timeframe and currency pair can use the Power Fuse indication.
The blue, red, and yellow dots that represent the MACD indicator’s implementation in this Forex system are as follows:
- Blue dots indicate the MACD’s upward trend.
- Red Dots: These symbols represent the MACD’s downward trend.
- Yellow Dots – These dots are situated near the MACD’s zero value, which serves as a sort of boundary between the rising and falling trend.
- Bollinger bands are represented by light blue lines
- According to the Bollinger bands, the red and blue dashed lines depict the market’s mood at the time.
| |
Given that the standard oscillator is painted in a solid color, which makes signals on it difficult to see, the Power Fuse indicator’s line made up of circles of various colors is fundamentally identical to MACD. However, it is much easier to examine its marking.
With the help of this forex trading system, you can receive trade signals that you can either use as-is or further filter with your own chart analysis. Although this strategy can be used by traders of all experience levels, it may be helpful to practice trading on an MT4 demo account first until you are reliable and self-assured enough to trade in real time.
Parameters for the Power Fuse Indicator Input
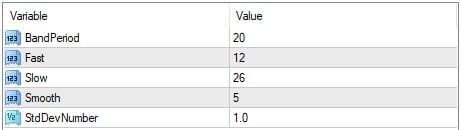
- BandPeriod is the time frame used to calculate Bollinger bands;
- Standard MACD settings for Fast, Slow, and Smooth.
- The number of standard deviations used when creating the BB channel is represented by the constant StdDevNumber;
Any Forex currency pair as well as other assets like stocks, commodities, cryptocurrencies, precious metals, oil, gas, etc. can be traded with the Power Fuse RSX Indicator. Additionally, you can use it on any time period that works best for you, from the charts for 15 minutes to the 4-hour charts. For optimum results, use H1 timeframes.
| |
 | No Minimum Deposit ECN Acount No Commission | |
Min Deposit of 20$ |
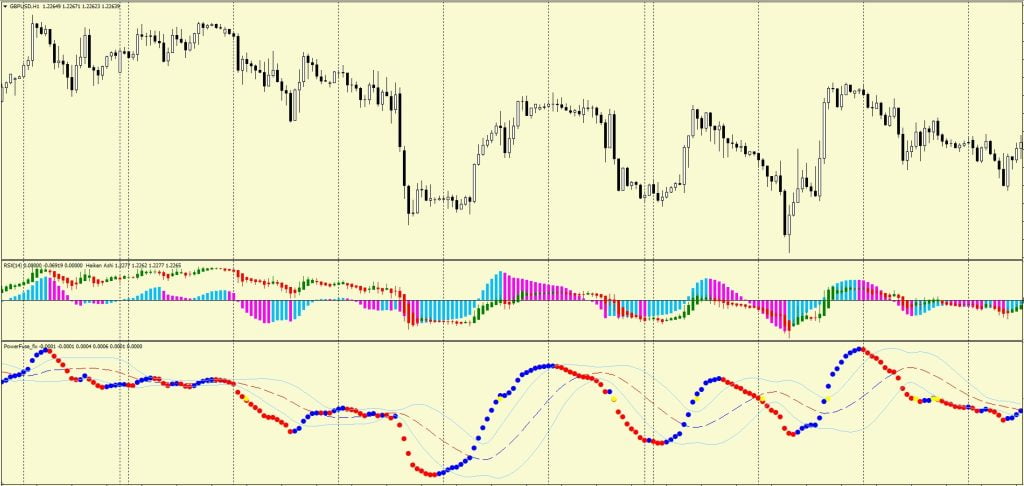
When there is a buy signal, the yellow dot is above the Power Fuse indicator’s upper band and the blue histogram; when there is a sell signal, the yellow dot is below the Power Fuse indicator’s lower band and the red histogram.
When an opposing signal comes, either use your own SL/TP and Exit positions or leave the order. To be taken into account while placing an order, the RSX histogram value should be below or above zero.
| |

| |